|
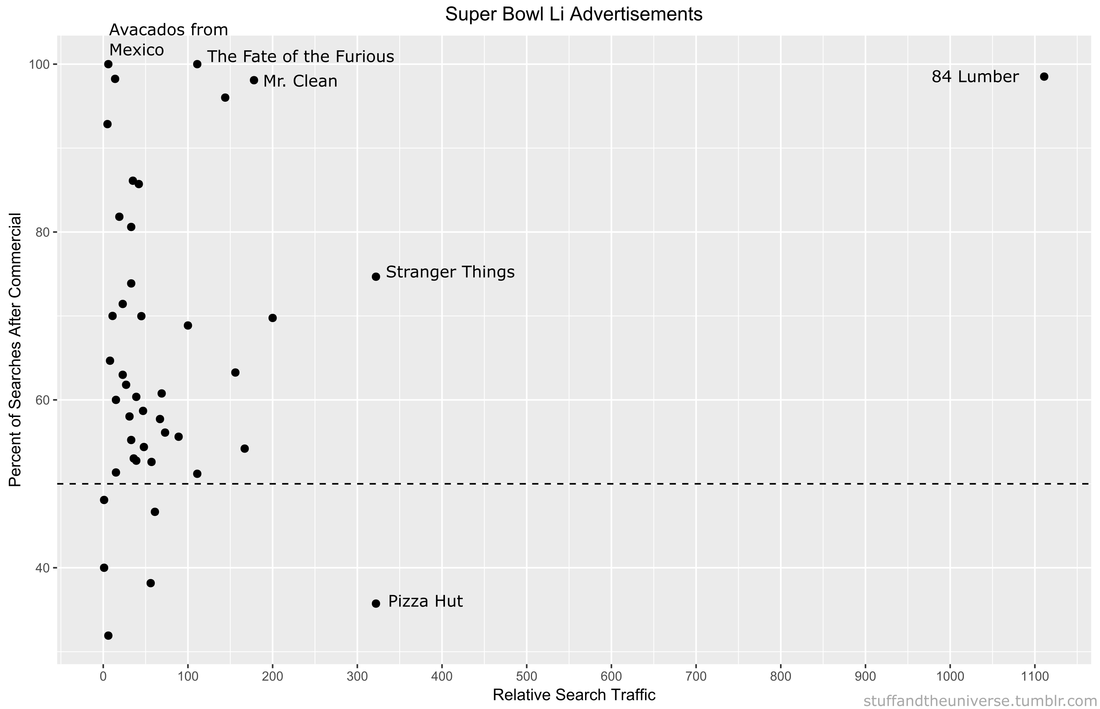
Remember Super Bowl LI you guys? It happened, at minimum, five days ago and of course Tom Brady won what was actually one of the best Super Bowls in recent memory. Football, however, is only one half of the Super Bowl Sunday coin. The other half are the 60 second celebrations of capitalism: the Super Bowl Commercials. Everyone has a list of favorites. Forbes has a list. Cracked has a video. But it is no longer politically correct in this Great country to hand out participation trophies, someone needs to decide who actually won the Advertisement Game. To tackle (AHAHA) this question I turned to the infinite online data repository, Google Trends, which tracks online search traffic. Using a list of commercials compiled during the game (AKA I got zero bathroom breaks) I downloaded the relative search volume in the United States for each company/product relative to the first commercial I saw for Google Home. [Author’s note: Only commercials shown in Nebraska, before the 4th quarter when my stream was cut, are included]. Here’s an example of what that looked like: !The search traffic for a product instantly increased when a commercial was shown! You can see exactly in which hour a commercial was shown based on the traffic spike. Using the traffic spike as ground zero, I added up search traffic 24 hours prior to and after the commercial to see if the ad significantly increased the public’s interest in the product. Below is a plot of each commercial, with the percent of search traffic after the commercial on the vertical axis and the highest peak search volume on the horizontal. If you look closely you will see that some of them are labeled. If a point is below the dotted line the product had less search traffic after the commercial than before (not good). On average 86% of products had more traffic after their Super Bowl ad than before it. But there are no participation trophies in the world of marketing and the clear winner is 84 Lumber. Damn. They are really in a league of their own (another sports reference!). Almost no one was searching for them before the Super Bowl but oh boy was everyone searching for them afterwards. They used the ole only-show-half-of-a-commercial trick where you need to see what happens next but can only do that by going to their website. Turns out its a construction supplies company
Pizza Hut had a pretty large spike during their commercial, but it actually was not their largest search volume of the night. Turns out most people are searching for pizza BEFORE the Super Bowl. Stranger Things 2 also drew a lot of searches for obvious reason. We all love making small children face existential Lovecraftian horrors. Other people loved the tightly-clad white knight Mr. Clean and his sensual mopping moves. The Fate of the Furious commercial drew lots of searches, most likely of people trying to decipher WTF the plot is about. Finally there was the lovable Avocados from Mexico commercial. No one was searching for Avocados from Mexico before the Super Bowl, but now, like, a couple of people are searching for them. Win. So congratulations 84 Lumber on your victory in the Advertisement Game. I’m sure this will set a dangerous precedent for the half-ads in Super Bowl LII.
1 Comment
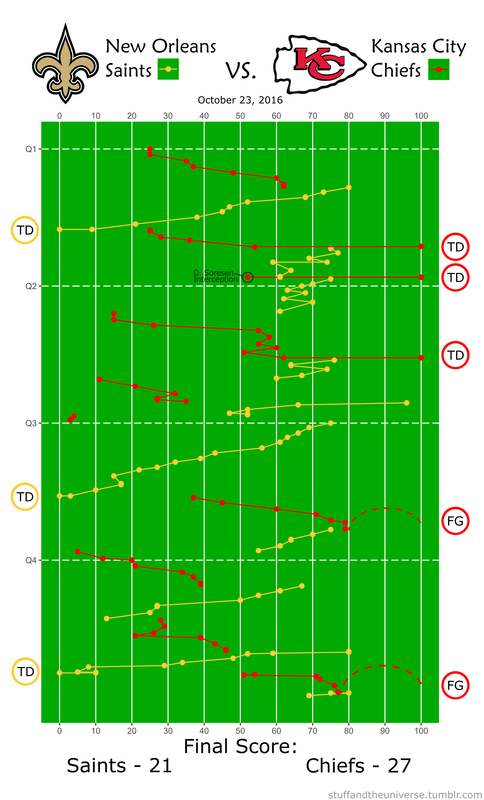
It’s possible to find play-by-play win probability graphs for every NFL game, but that does not tell me much about how the game itself was played. Additionally, I only sporadically have time to actually WATCH a game so using play-by-play data, R, and Inkscape I threw together this visualization of every play in this past Sunday’s game between the Kansas City Chiefs and New Orleans Saints. Why isn’t this done more often?
|
Archives
July 2023
Categories
All
|


 RSS Feed