|
Recently at brunch someone made a statement about there being only one person with a PhD in the US House of Representatives. This did not seem probable to me and after some Googling, I found that the House Library conveniently maintains a list of doctoral degree holders in the 116th House. 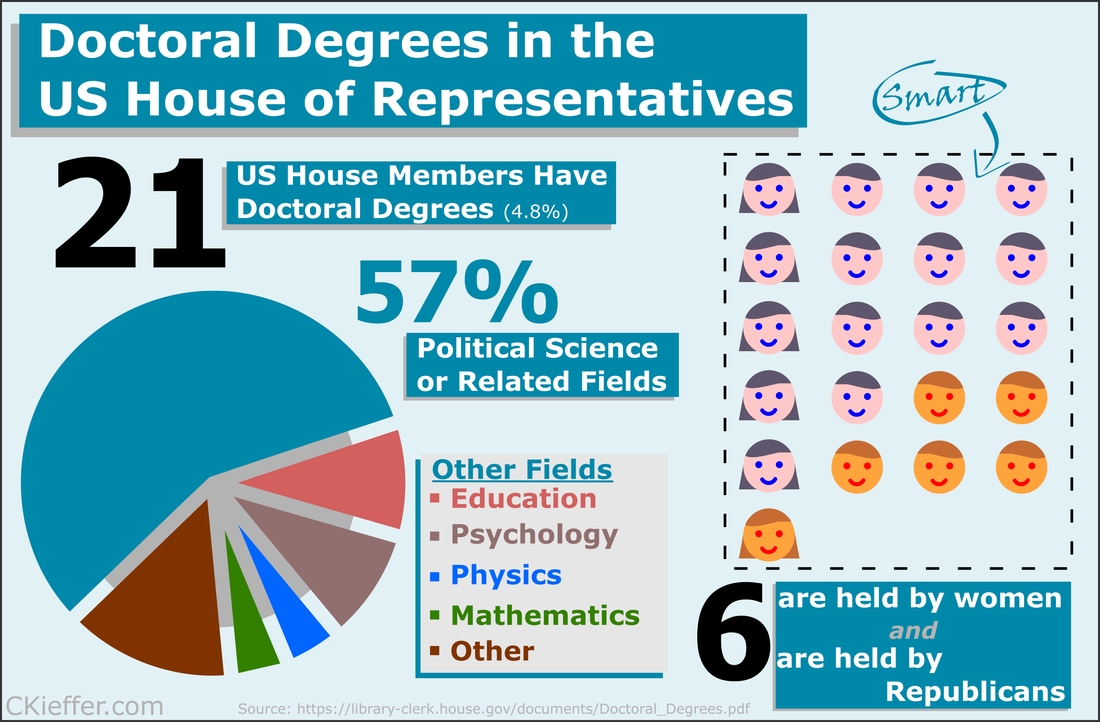 Though there is only one hard science PhD in the house (Bill Foster, D-IL; Physics), there are also other STEM doctorate holders in the House including two psychologists, a mathematician, and a monogastric nutritionist. There are also obviously quite a few other doctorate holders, most of which are in political science (obviously), but also a Doctor of Ministry from Alabama (Guess the political party!).
Overall 21 is a small fraction of the House (only 4.8%), especially compared to the 157 members that are lawyers. Given the wide-reaching and technical nature of the government and the laws that regulate it, it may be advantageous to increase the number of scientists represented in Congress. While that is a decision ultimately for each state's voters, there are a number of programs aimed at increasing the involvement of scientists in government policy. As an infographic making exercise I would consider this a mixed success. I think it conveys the information effectively, but lacks a certain je ne sai quoi in the aesthetics department. My little emoji heads especially could use some work. Any graphic designers out there please reach out with tips. The House Library maintains lists of lawyers, military service members, medical professionals, as well as other specialties in their membership profile. I am going to download these lists as a baseline for the analysis of future Congresses.
2 Comments
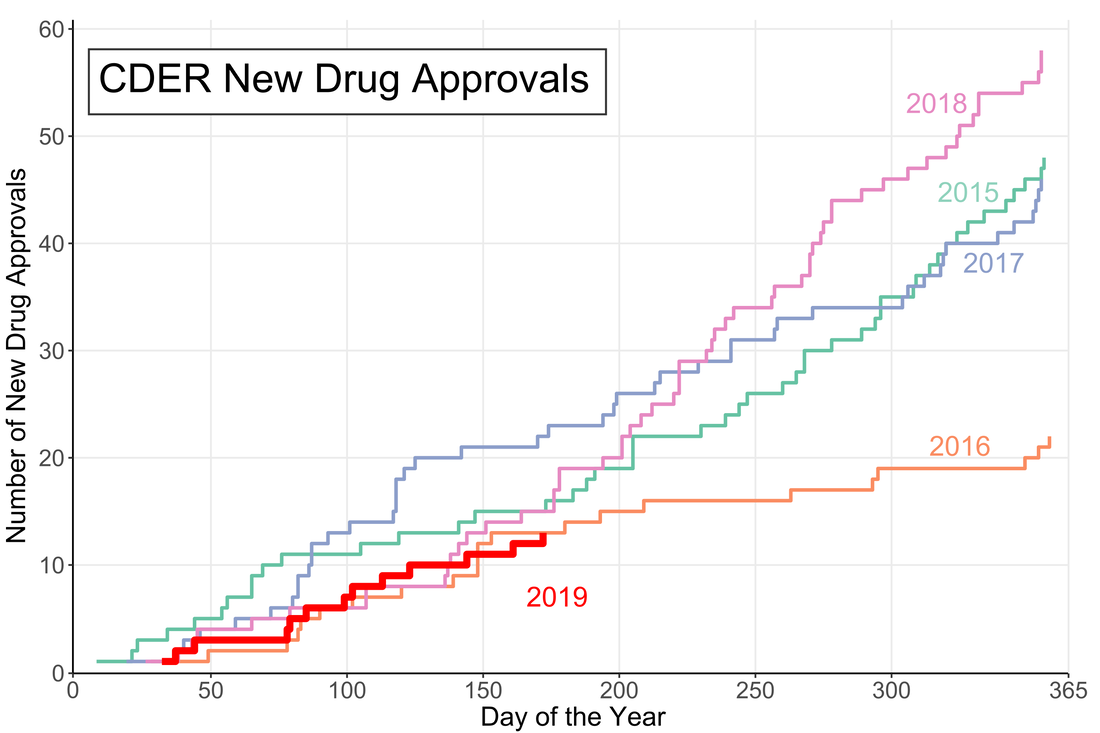 A little over halfway through the year and the US Food and Drug Administration (FDA) appears to be on track for either a big year of new drug approvals or....not. The number of new molecular entities (NMEs) approved by FDA's Center for Drug Evaluation and Research (CDER) are equal to the number approved at this point of the year in 2016 and only two product apporvals behind both 2018 and 2015. Despite starting the year off with the longest federal shutdown in history the FDA is keeping pace with past years.
However, the figure demonstrates another important fact: approval numbers mid-year do not correlate strongly with year-end approvals. While the number of approvals were similar in 2016 and 2018, the end year totals were wildly different. In 2018, CDER approved a record 59 NMEs while 2016 approved less than half of that number. Additionally, in 2017, the number of NME approvals at mid-year was much higher than any other year, but finished in line with the number of approvals in 2015 and well below the number of approvals in 2018. It seems that the future could go either way. There could be a dramatic up-tic in CDER approval rate as in 2018 (perhaps from shutdown-delayed applications) or the rate could slow to a crawl like in 2016. |
Archives
July 2023
Categories
All
|
 RSS Feed