|
Where can love be found? Presumably, anywhere: school, the internet, a coffee shop, even, as Rihanna pointed out in her 2011 hit song, in a hopeless place. In 2002, that list grew and love could also be found on television.
Having never seen a single episode of The Bachelor, I thought I would be the perfect person to write about it authoritatively after several hours of research. This impulse was derived, in part, from a friend’s recommendation that I apply to be on the show. Regardless, I will briefly be presenting The Bachelor in three ways: Bachelor as text, Bachelor as subtext, and Bachelor as commodity. Or, in other words, what the show does, what the show says, and what the show is. Part I: The Bachelor as text On its face, the bachelor is a straightforward show. Twenty-five women compete for the affections of one eligible bachelor. Contestants and the bachelor go on dates to gauge their compatibility and each episode ends with a rose ceremony. At the ceremony the titular bachelor gives roses to the subset of women that he would like to keep around and get to know, ultimately leading to a final ~magical~ proposal. In it’s imagery, unsurprisingly, the show leans heavily on romantic elements, elevating and magnifying the fantasy of the show to mythic proportions. There is a mansion, the women wear ravishing evening gowns, there are dates in exotic locations, the show provides the perfect diamond ring. There’s even a “fantasy suite.” While proposal and possibly marriage are the end of the fairy tale, this pedestrian description of the show’s structure does not capture the essence of the themes that the show conveys. Part II: The Bachelor as subtext As you may have already surmised, the “reality” in this reality tv show is anything but. The critiques of the show are many and varied: it fetishizes beauty, it objectifies women, it exclusively celebrates heterosexual romance. As Caryn Voskuil enunciated in the 2006 anthology Television, Aesthetics, and Reality, “television may have the capacity to bring about social change, [but] more often than not, it is a mirror of societies’ values and beliefs - a “myth promoter” that entertains while maintaining the status quo.” The Bachelor has no problem living in the status quo and promoting the existing myths about true love and fantastical romance. Its whole premise is based on these concepts. It takes existing social constructs of dating, both good and bad, heightens them in a ritualistic fantasy environment, and ends with an idealized amplification of those constructs pitched to the audience as reality. This show is not advancing the social discourse. However, that unrealistic fantasy itself may be the escape its audience is looking for. The courtship depicted in the show is a far cry from the real dating world where, according to Pew Research in 2020, more than half of Americans say dating app relationships are equally successful to those that begin in person. But, with some 35% of app users saying online dating makes them more pessimistic, maybe a glimpse into a mythic fantasy, pitched as reality, where traditional values are never challenged is an appealing product. While the underlying messages of the show may not be the most progressive, perhaps these concerns are overblown and the negative societal consequences only manifest if one truly believes in the show’s premise. Is anyone fooled? Does anyone think it accurately reflects reality? Part III: The Bachelor as commodity After 263 episodes, the bachelor and its many spin offs have become a mass produced media product rather than a cultural text. Over those 25 seasons, there were 15 marriage proposals with only two couples currently together, as of this writing. These results savagely undercut the mythic romance narrative sold to the audience in the text of the show, making it unlikely that it is taken on face value. While the problematic subtext remains, the show is now being rigorously dissected and enjoyed through a collection of meta-narratives, narratives grafted on top of the repetitive framework of the show, rather than the surface-level text of the show One such meta-narrative analyzes the show’s production logistics. How many instagram followers do the contestants have? How do producers make people cry or find the perfect shot to make it look like a fight occurred? Another looks at The Bachelor as sport. The Bachelor has many of the same attributes as traditional sports: weekly appointment viewing, suspense, narratives, ritual, and excitement. There are fantasy bachelor brackets and leagues. These meta-narratives are possible because of the decades-long commoditization and standardization processes over dozens of seasons. They heighten the enjoyment of watching the show, while abstracting above any problematic aspects or subtexts. Which of these is the true bachelor? Should we believe what the show does, what it says, or what it is? Of course the answer is that it is all three at once. The Bachelor is a complex show, despite the repetitive traditions it has embraced over the years. It is a sports media product about finding love in an unrealistic reality. Which, when I put it like that makes it sound a bit appealing. Maybe I will have to give it a watch. This post was adapted from a seven-minute speech presented at a Toastmasters club.
1 Comment
Bill James’s Pythagorean expectation is a simple equation that takes the points scored by a team and the points scored against that team over a season and predicts their win percentage. Originally developed for baseball, it was adapted in the early 2000s for football, the other football, basketball, and hockey. In the interest of science I applied the same equation to our intramural Ultimate Frisbee team “The Jeff Shaw Experience”:
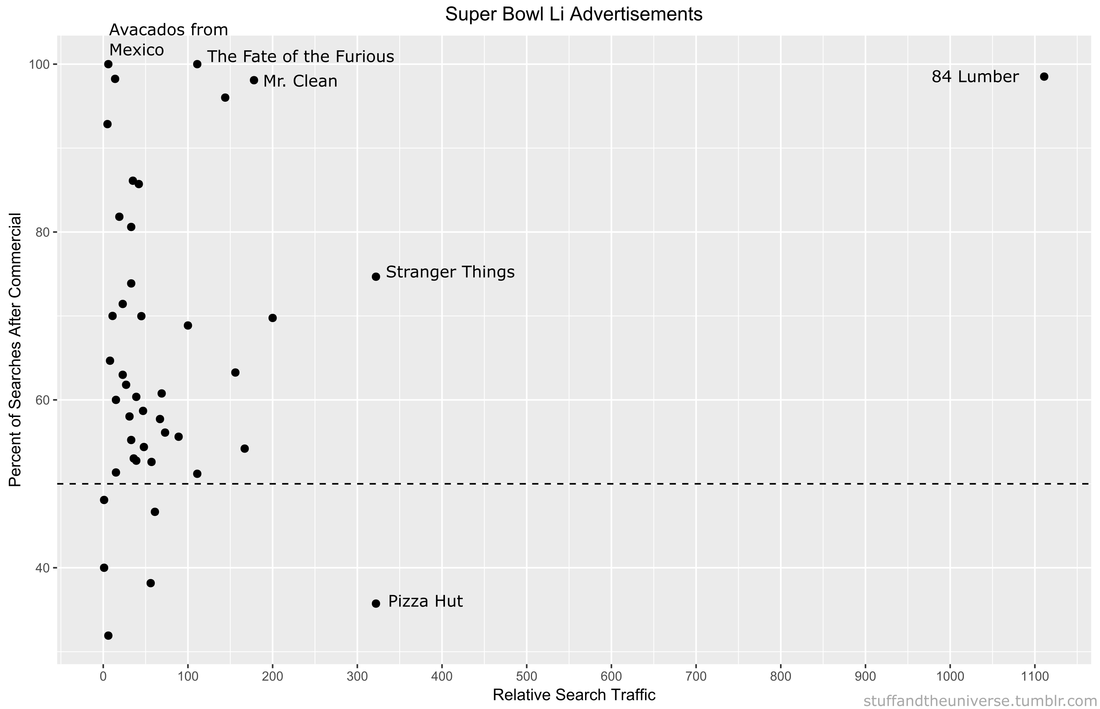
\[ Win\% = \frac{(Points For)^2}{(Points For)^2 + (Points Against)^2} \] Our Ultimate Frisbee Team’s expected win percentage based on this formula is 36.9%. Over a four game “season” this roughly translates to 1.5 wins. This seems like a significant departure from our actual 0.500 record. Of course, it’s impossible to win 0.5 games, so the only possibilities are winning 1 or 2 games (or 0 or 3 or 4). Still, there is something that we can learn about our team by our over performance. When we lose a game, we lose by a lot, but when we win, it is often close. As our team’s example makes obvious, a longer season would allow for better predictions. With enough games we could even set up an ELO system to predict the winners of individual games (like FiveThirtyEight does for seemingly every sport). This also assumes 2 is the proper Pythagorean exponent for Ultimate Frisbee and this league, but that is a topic that is WAYYY too big for this blog. Hopefully our first playoff game will give us a much needed data point to further refine our expected wins. Hopefully our expected wins go up. Remember Super Bowl LI you guys? It happened, at minimum, five days ago and of course Tom Brady won what was actually one of the best Super Bowls in recent memory. Football, however, is only one half of the Super Bowl Sunday coin. The other half are the 60 second celebrations of capitalism: the Super Bowl Commercials. Everyone has a list of favorites. Forbes has a list. Cracked has a video. But it is no longer politically correct in this Great country to hand out participation trophies, someone needs to decide who actually won the Advertisement Game. To tackle (AHAHA) this question I turned to the infinite online data repository, Google Trends, which tracks online search traffic. Using a list of commercials compiled during the game (AKA I got zero bathroom breaks) I downloaded the relative search volume in the United States for each company/product relative to the first commercial I saw for Google Home. [Author’s note: Only commercials shown in Nebraska, before the 4th quarter when my stream was cut, are included]. Here’s an example of what that looked like: !The search traffic for a product instantly increased when a commercial was shown! You can see exactly in which hour a commercial was shown based on the traffic spike. Using the traffic spike as ground zero, I added up search traffic 24 hours prior to and after the commercial to see if the ad significantly increased the public’s interest in the product. Below is a plot of each commercial, with the percent of search traffic after the commercial on the vertical axis and the highest peak search volume on the horizontal. If you look closely you will see that some of them are labeled. If a point is below the dotted line the product had less search traffic after the commercial than before (not good). On average 86% of products had more traffic after their Super Bowl ad than before it. But there are no participation trophies in the world of marketing and the clear winner is 84 Lumber. Damn. They are really in a league of their own (another sports reference!). Almost no one was searching for them before the Super Bowl but oh boy was everyone searching for them afterwards. They used the ole only-show-half-of-a-commercial trick where you need to see what happens next but can only do that by going to their website. Turns out its a construction supplies company
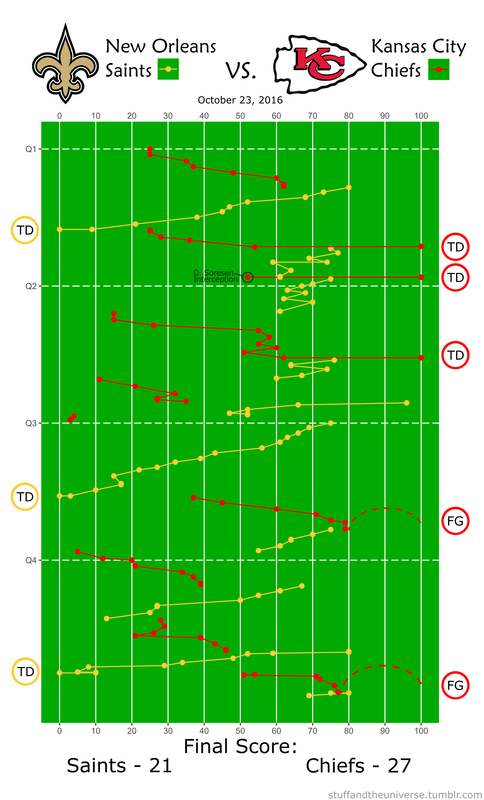
Pizza Hut had a pretty large spike during their commercial, but it actually was not their largest search volume of the night. Turns out most people are searching for pizza BEFORE the Super Bowl. Stranger Things 2 also drew a lot of searches for obvious reason. We all love making small children face existential Lovecraftian horrors. Other people loved the tightly-clad white knight Mr. Clean and his sensual mopping moves. The Fate of the Furious commercial drew lots of searches, most likely of people trying to decipher WTF the plot is about. Finally there was the lovable Avocados from Mexico commercial. No one was searching for Avocados from Mexico before the Super Bowl, but now, like, a couple of people are searching for them. Win. So congratulations 84 Lumber on your victory in the Advertisement Game. I’m sure this will set a dangerous precedent for the half-ads in Super Bowl LII. It’s possible to find play-by-play win probability graphs for every NFL game, but that does not tell me much about how the game itself was played. Additionally, I only sporadically have time to actually WATCH a game so using play-by-play data, R, and Inkscape I threw together this visualization of every play in this past Sunday’s game between the Kansas City Chiefs and New Orleans Saints. Why isn’t this done more often?
|
Archives
July 2023
Categories
All
|


 RSS Feed