|
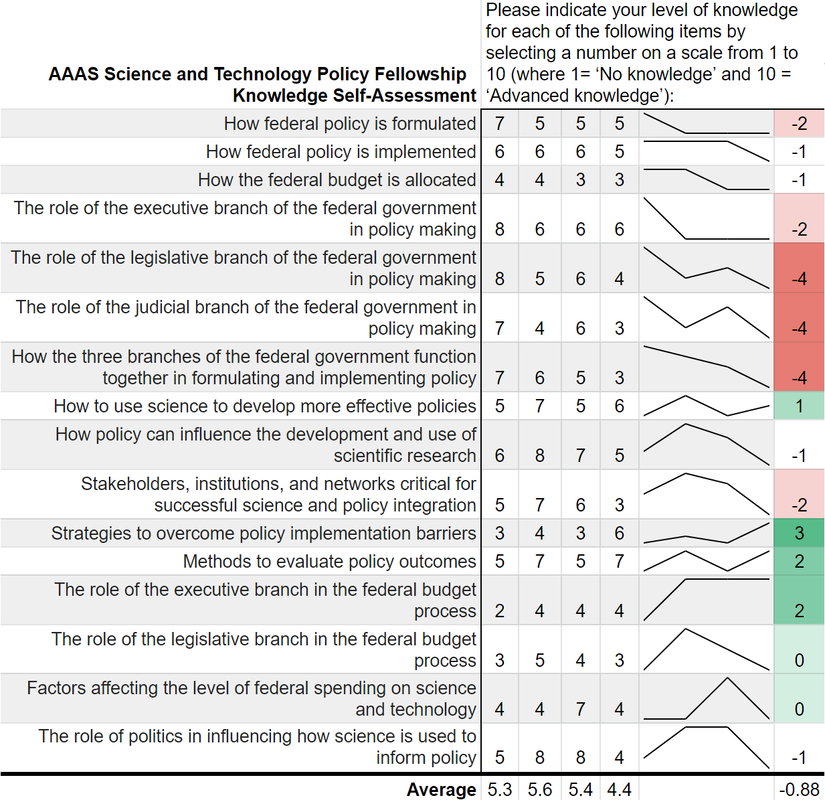
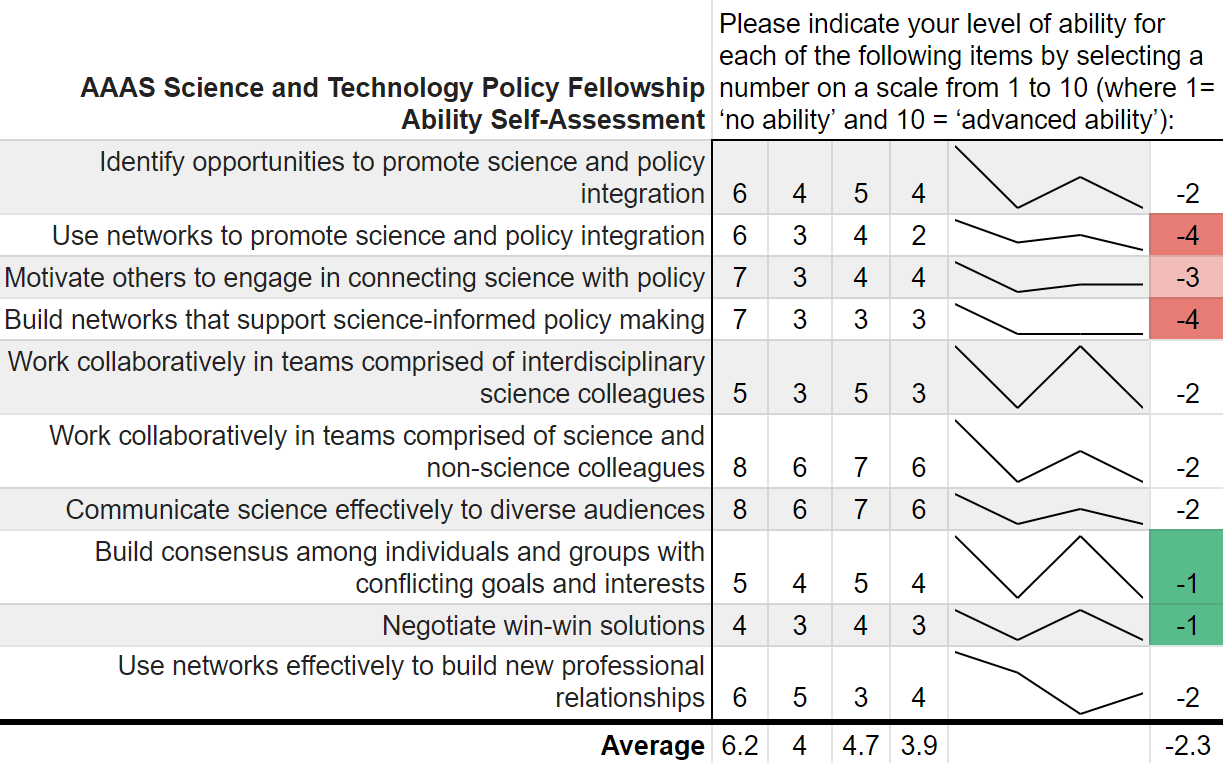
“Can you teach an old scientist new tricks?” is a question that you have likely never asked yourself. But if you think about it, presumably, scientists should be adept at absorbing new information and then adjusting their world view accordingly. However, does that hold for non-science topics such as federal policy making? More and more the United States needs scientists who have non-science skills in order to make tangible advancements on topics such as climate change, space exploration, biological weapons, and the opioid crisis. The American Association for the Advancement of Science (AAAS) Science and Technology Policy Fellowship (STPF) helps to meet that need for scientists in government as well as to teach scientists the skills they need to succeed in policymaking. As the United States’ preeminent science policy fellowship, the AAAS STPF places doctoral-level scientists in the federal government to increase evidence-informed practices across government. In 2019, the program placed 268 scientists in 21 different federal agencies. Beyond simply lending some brilliant brains to the government, the AAAS STPF is a professional development program meant to benefit the scientist as much as the hosting agency. In addition to hands-on experience in government, fellows create individual development plans, attend professional development programming, start affinity groups, and spend program development funds. As part of its monitoring and evaluation of the learning in their program, AAAS sends out a biannual survey—that is, two times per year—to fellows to monitor changes in knowledge and ability, among other things. Now, as a spoiler, I was a AAAS STPF from 2019-2021 and I am sharing some of my survey results below, presented in the most compelling data visual medium—screenshots of spreadsheets. Each of the four columns represents on of the biannual surveys. Let's see how much I learned: Um, where is the learning? Starting with my knowledge self-assessment, the outcomes are, at first blush, resoundingly negative. The average scores were lowest in the final evaluation of my fellowship (4.4 points) with an average fellowship-long change of -0.88 points. I was particularly bullish on my confidence in understanding each branch’s contribution policy making at the beginning of the fellowship and incredibly unsure of how policy was made at the close of the fellowship. There is however, one positive cluster of green boxes. These seem to focus more on learning about the budget, which I initially knew nothing about. Also, the positive items—with terms like “strategies” and “methods”--are more tangible and action focused. This would seem to support the value of the hands on experience compared to some of the more abstract concepts of how the government at large works. While not a glowing assessment of the program, let’s move on to the ability self-assessment… Yikes; that's even worse! There isn’t a single positive score differential on my ability self-assessment across the two years. Did I truly learn nothing? While the knowledge self-assessment had a small average point decline across the two years of the fellowship (0.9 points), the ability self-assessment had a larger average decline of 2.3 points. This decline was largest in my perceived ability to use and build networks. The working hypothesis to explain this discrepancy is, what else, the COVID-19 global pandemic. This dramatically reduced the ability to meet in groups and collaborate, something that many of these ability questions focus on. My responses here also had more noise and fewer clear trends compared to the knowledge self-assessment.
While COVID-19 likely played some role, both parts of the survey suffer from a pronounced Dunning-Kruger effect. Before the program I read the news, had taken AP Government, and had seen SchoolHouse Rock. Apparently, I thought that was sufficient to make me well-informed. This was a bold opinion considering that I was not 100% sure what the State Department did. After some practical experience in government, I slowly understood the complexities of the interconnected systems. Rather, I should say that I did not understand the labyrinthine bureaucracies, but at least began to appreciate their magnitude. That appreciation is what contributed to the decrease in survey scores over time. Not a lack of learning, but instead the learning of hidden truths juxtaposed with my initial ignorance. Despite these survey data, the AAAS STPF has taught me a tremendous amount about the federal government, policy making, and science’s role in that process. The first question on the survey is “Overall, how satisfied are you with your experience as a AAAS Science & Technology Policy fellow?” which I consistently rated as “Very Satisfied.” Increasingly, more and more fellows are remaining in the same office for a second year, indicating a high level of program satisfaction. The number reupping now sits around 70%. Finally, this is only a single data point from me. I did not ask AAAS for their data, but I have a sneaking suspicion that would be reluctant to part with it. Therefore, it is possible that no other fellows have this problem. Every other fellow is completely clear eyed and knows the truth about both themselves and the U.S. government. But if that was the case, then we wouldn’t need the AAAS STPF at all. I am glad that I learned what I didn’t know. Now I am off to learn my next trick.
2 Comments
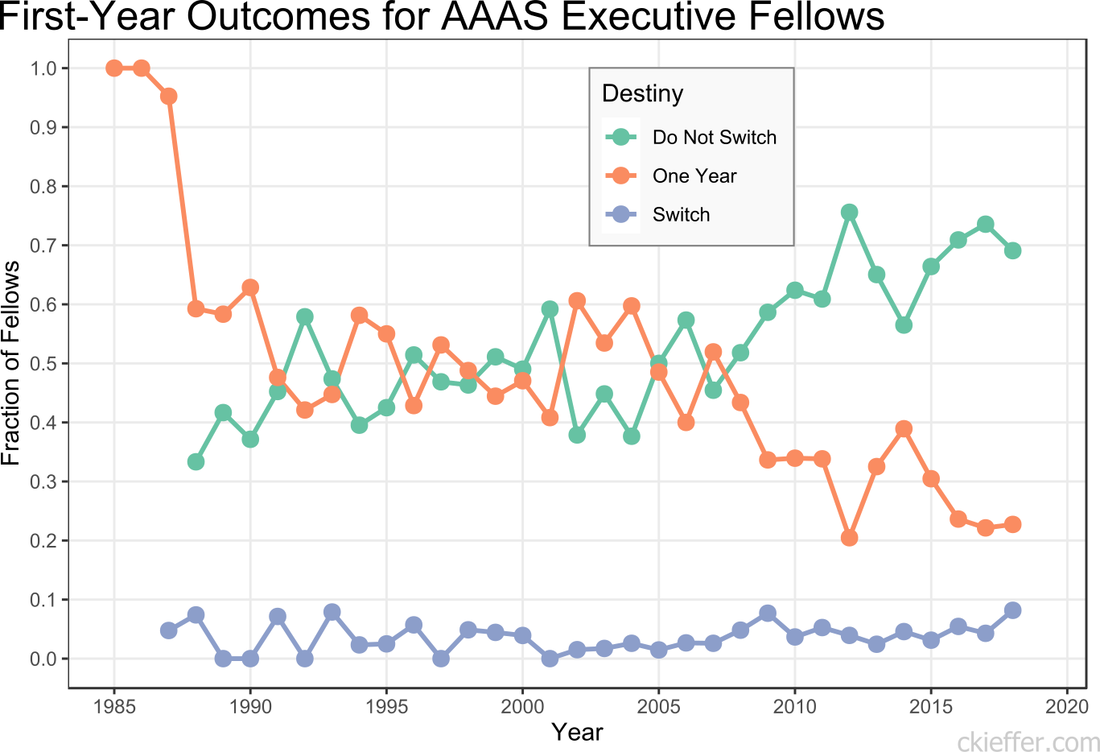
James Bond, secret agent, man of mystery, world traveler. Bond traverses the globe foiling devious plots from evil masterminds in the service of the Queen. To support his missions, his tech-savvy colleague Q equips him with fantastic gadgets. He has a watch that shoots lasers, a pen that shoots lasers, and a belt buckle that shoots lasers. Anything is possible.
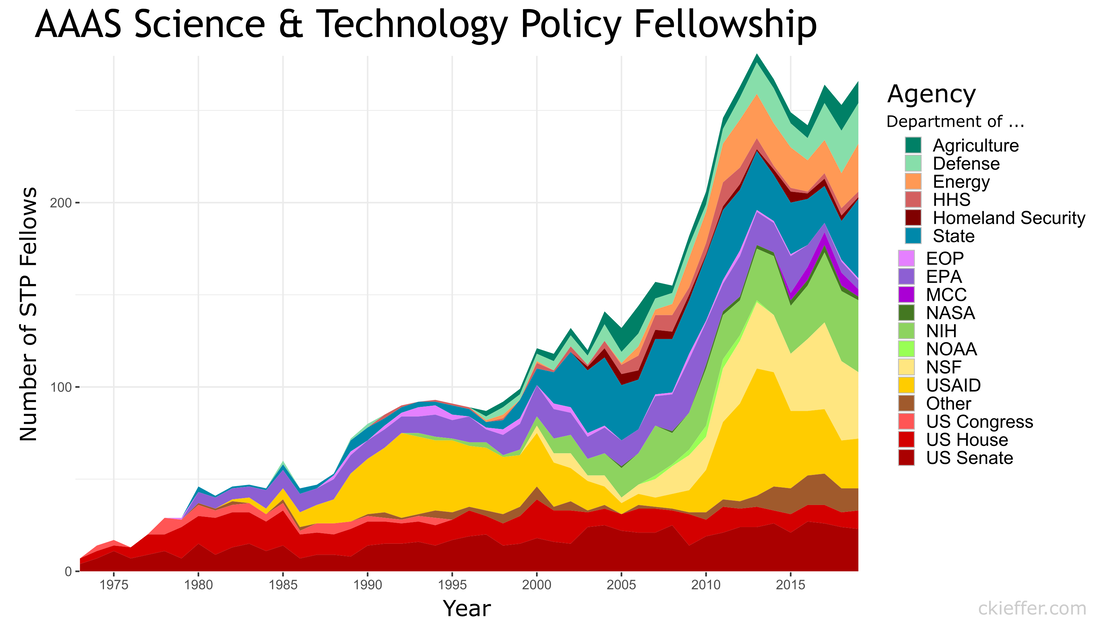
One of his most notable gadgets is his car, a modified Aston Martin. But a car is only as good as the road it drives on, which leads us to his final secret weapon, The Interstate Highway System. While Bond’s travels took him to far-flung, exotic places, today I want to write about the secret weapon we all have access to here in the United States. It transformed the way Americans live, it strengthened the U.S. economy, but unfortunately, it is facing an existential crisis. The idea for a supercharged network of cross-country roads came from President Dwight D. Eisenhower after his own miserable experience traversing the country in a staggeringly slow 62-day trip, as well as his experience with the German Autobahn network in World War 2. The Eisenhower National System of Interstate and Defense highways, was authorized by the Federal Aid Highway Act of 1956, the same year that the Bond novel Diamonds are Forever was published. While most secret gadgets are small and compact, the interstate highway system is over 48 thousand miles long. This is enough to (almost) circle the entire earth twice, making it larger than any other known secret spy gadget. The centrally managed construction created a logically ordered country-spanning network. Even numbers run east to west, odd numbers run north to south. Additionally, interstates have no at-grade road crossings, no stop signs or stop lights, and have limited on and off ramps. These small changes give cars the superpower to travel at greater speeds with fewer interruptions while also improving passenger safety. This increased speed transformed the average American way of life. The use of trains decreased dramatically. Interstates allowed for the suburbs to emerge, enabling workers (including spies) to live outside the city and commute into the city each day. Beyond transporting people, the key benefit of the interstate system is its ability to rapidly move goods from point A to point B. They are literally the groundwork enabling commercial growth making the interstates the secret weapon of the economy. James Bond helps the U.K.’s MI6, the interstates help the U.S0.’s GDP. Everyday almost everything we eat, buy, or use is transported via Interstate highway at some point. In 2015 the department of transportation reported that 10 billion tons of freight was moved on roads. It also enabled domestic and foreign tourism creating demand for gas stations, motels, restaurants and most importantly, roadside tourist traps including the biggest ball of twine, carhenge (a stone henge made of cars), and the Spam museum. These are monumental benefits, but James Bond always had Q to ensure his gadgets were always tip top shape. The U.S. has an army of Q’s constantly repairing our roads, but despite their best efforts, they continue to crumble faster than they can be mended. The federal highway system is funded, in large part, by a tax on gasoline. This tax currently sits at 18.4 cents per gallon, which is not a lot. The last gasoline tax increase was made by president Clinton in 1993. As a result, revenues have not been adequate since 2008 and billions of dollars of projects go unfunded every year. In 2017, The Infrastructure Report Card gave America’s road infrastructure a D. Imagine if James Bond was still getting paid a 1993 salary in 2021. That doesn’t buy many martinis. The gas tax should be raised. Alternatively, the federal government could devise another means to raise revenues to hire more Q’s to maintain our beloved interstate highways. Now, an argument could be made that we shouldn’t fix the roads at all if they are being used by international spies. However, I would contend that we all need these roads. As described above, they are a fundamental part of American life, they are critical for our economic infrastructure, and despite their flaws, they should be saved from this crisis. The Interstate Highway System is a secret weapon that millions of Americans use use everyday, even if it does help a few pesky spies. This post was adapted from a seven-minute speech presented at a Toastmasters club. Previously, I presented information on the agency composition over time of American Association for the Advancement of Science (AAAS) Science and Technology Policy Fellows (STPF). This analysis was based on the data collected from the publicly available database of AAAS fellows. The goal of the program is to place Ph.D.-level scientists into the federal government to broadly increase science- and evidence-based policy. The STPF program consists of both executive and legislative branch fellows. Executive branch fellows enter into a one-year fellowship, with the option to extend their fellowship after their first year. Additionally, fellows can reapply to transition their fellowship to other offices around the federal government. To extend my previous analysis, I re-analyzed the data to discover the "destiny" of first-year fellows. How many fellows chose to stay in the same agency after their first year, leave the program, or switch agencies? The number of fellows that “Do Not Switch” and remain in the same office for both years, has been trending upwards over time. Over the past five years, on average, 67.3 percent of fellows completed both years of their fellowship in the same agency. The remaining 32.7 percent either left after the first year or switched to a different agency. Reasons for this increasing trend are not discernible from the data. More and more offices (or even fellows) may be treating this as a full two-year fellowship rather than a one-and-one. Early executive branch fellows only had a one-year fellowship, leading to the dramatic 100 percent program exit after a single year. Historically, the percentage of executive branch fellows who switch offices between their first and second years has been low and has never exceeded nine percent. However, the year with the largest number of switches was recent. The largest total number of switches was by fellows who began their first year in 2018, nine (8.1 percent) switched agencies. That year, six of the nine fellows who switched departments moved into the Department of State. The largest number of one-year switches out of a single agency was four. The data were not analyzed for office switches within the same agency and only inter-agency transfers are recorded as changes. This may lead to under-reporting of position switches. Additionally, some fellows who leave the STPF program after their first year may have received full-time positions at their host agency. While they are no longer fellows, they did not actually leave leave their agency and conceivably could have stayed for a second year of the STPF program there. Unlike the executive branch fellowship, AAAS’s legislative branch fellowship is only a one-year program. However, some legislative branch fellows apply for, and eventually receive, executive branch fellowships. Over the history of the fellowship program 106 fellows have moved directly from congress into an executive branch fellowship the following year. This is out of the total 1,399 congressional fellows. The previous five-year average for fellows moving from The Hill to the executive branch is 7.2 fellows per year or 36 total fellows in the past five years. Overall, it appears that the AAAS STPF program’s opaque agency-fellow matching process is doing an increasingly good job of helping fellows find agencies where they are happy to live out the full two years of their executive branch fellowship experience. Since 1973, the American Association for the Advancement of Science (AAAS) has facilitated the Science & Technology Policy fellowship (STPF). The goal of the program is to infuse scientific thinking into the political decision making process, as well as developing a workforce that is knowledgeable in both policymaking and science. Intuitively, it makes sense to place evidence-focused scientists in the government to support key decisions makers. Each year doctoral-level scientists are placed throughout the federal government for one to two year fellowships. Initially the program placed scientists exclusively in the Legislative branch, but as the program grew, placements in the Executive branch became more common. In 2019, hundreds of scientists were placed in 21 different agencies throughout the federal government. As one of those fellows, I wanted to create a Microsoft Excel-based directory of current fellows. However, what began as a project to develop a simple CSV file turned into a visual exploration of the historic and current composition of the AAAS STPF program. Below are some of my observations. Data was collected from the publicly available Fellow Directory. In the beginning of the STPF program, 100% of fellows were placed in the Legislative Branch. This continued until the first Executive branch fellows around 1980 were placed in the State Department, Executive Office of the President (EOP), and the Environmental Protection Agency (EPA). In 1986, the number of Executive Branch fellows overtook the number of Legislative Branch Fellows for the first time. Since those initial Executive Branch placements, fellows have found homes in 43 different organizations. The U.S. Senate has had the largest total number of fellows while the U.S. Agency for International Development (USAID) is the Executive Branch agency that has had the most placements. Unfortunately, for the clarity of the figure, agencies with fewer than twenty total fellow placements were grouped into a single "other" category. Despite the mundane label, this category represents strength and diversity of the AAAS STPF. The "other" category encompasses 25 different agencies including the Bureau of Labor Statistics, the World Bank, the Bill and Melinda Gates Foundation, and the RAND Corporation. In 2017, fellows were placed in 24 different organizations, the most diverse of any year. The total number of fellows has dramatically increased over the past 45 years (as seen in the grey bar plot at the bottom of the figure). The initial cohort of congressional fellows in 1973 had just seven enterprising scientists. Compare that to 2013 when a total of 282 fellows were selected and placed. This year (2019) tied 2014 for the second highest number of placements with 268 fellows. One of the most striking observations is the trends in placement at USAID. In 1982 USAID began to sponsor AAAS Executive Branch fellows, with one placement. Placements at USAID quickly grew, ballooning to over 50% of total fellow placements in 1992. However, just as rapidly, the placement fraction at USAID decreased during the 2000s despite only a small increase in the overall number of fellows. This trend ultimately began to reverse in 2010, and a large increase in the total number of fellows found placement opportunities at USAID. The reader is left to craft their own explanatory narrative. One thing is clear from the data: the AAAS STPF is as strong as it has ever been. Placement numbers are close to all-time highs and fellows are represented at a robust number of agencies. Only time will tell if the experience these fellows gain will help them achieve the program's mission "to develop and execute solutions to address societal challenges." If you want to learn more about the history of the STPF, including statistics for each class, AAAS has an interactive timeline on their website. An unexpected surprise during the analysis was the discovery that Dr. Rodney McKay and John Sheppard (both of Stargate Atlantis fame) were STP fellows. Or--more likely--the developer for the Fellows Directory was a fan of the show. Unfortunately, as a Canadian citizen, Dr. McKay would be ineligible for the AAAS STPF.
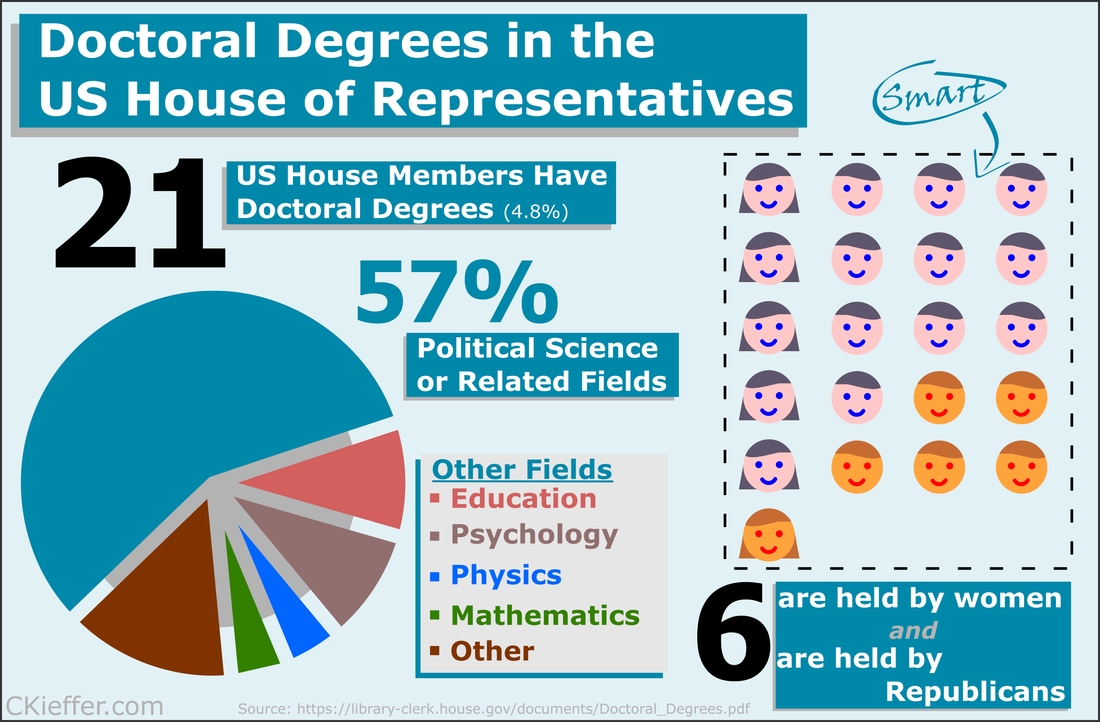
Recently at brunch someone made a statement about there being only one person with a PhD in the US House of Representatives. This did not seem probable to me and after some Googling, I found that the House Library conveniently maintains a list of doctoral degree holders in the 116th House. Though there is only one hard science PhD in the house (Bill Foster, D-IL; Physics), there are also other STEM doctorate holders in the House including two psychologists, a mathematician, and a monogastric nutritionist. There are also obviously quite a few other doctorate holders, most of which are in political science (obviously), but also a Doctor of Ministry from Alabama (Guess the political party!).
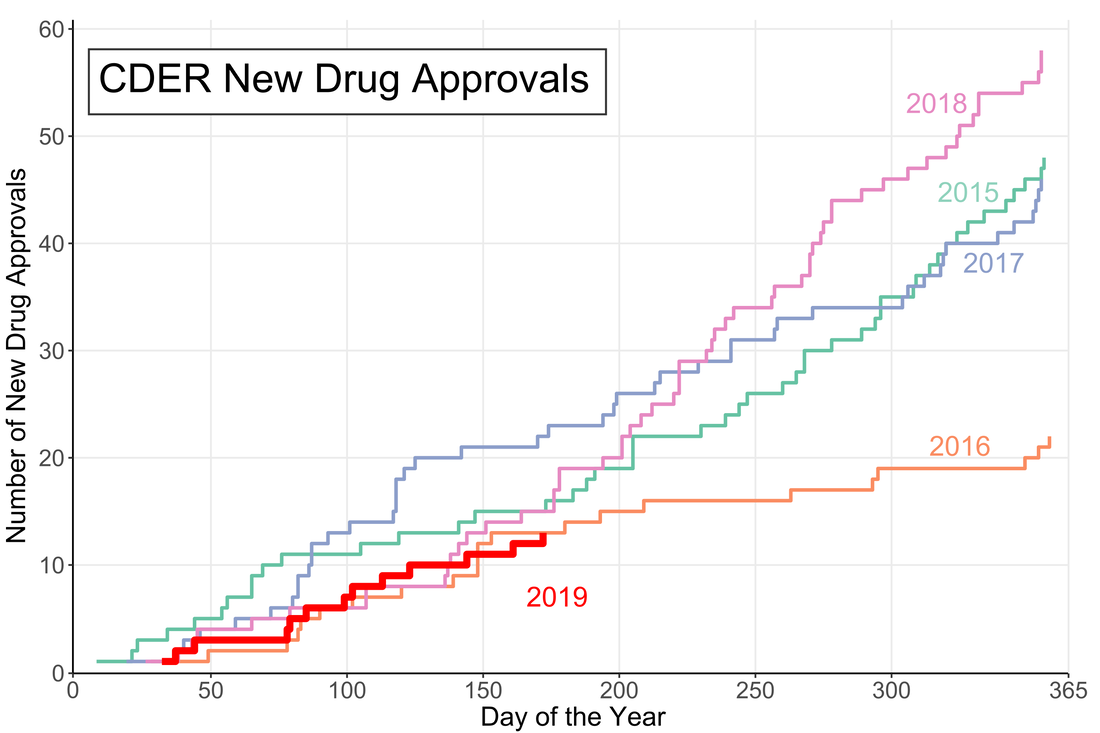
Overall 21 is a small fraction of the House (only 4.8%), especially compared to the 157 members that are lawyers. Given the wide-reaching and technical nature of the government and the laws that regulate it, it may be advantageous to increase the number of scientists represented in Congress. While that is a decision ultimately for each state's voters, there are a number of programs aimed at increasing the involvement of scientists in government policy. As an infographic making exercise I would consider this a mixed success. I think it conveys the information effectively, but lacks a certain je ne sai quoi in the aesthetics department. My little emoji heads especially could use some work. Any graphic designers out there please reach out with tips. The House Library maintains lists of lawyers, military service members, medical professionals, as well as other specialties in their membership profile. I am going to download these lists as a baseline for the analysis of future Congresses. A little over halfway through the year and the US Food and Drug Administration (FDA) appears to be on track for either a big year of new drug approvals or....not. The number of new molecular entities (NMEs) approved by FDA's Center for Drug Evaluation and Research (CDER) are equal to the number approved at this point of the year in 2016 and only two product apporvals behind both 2018 and 2015. Despite starting the year off with the longest federal shutdown in history the FDA is keeping pace with past years.
However, the figure demonstrates another important fact: approval numbers mid-year do not correlate strongly with year-end approvals. While the number of approvals were similar in 2016 and 2018, the end year totals were wildly different. In 2018, CDER approved a record 59 NMEs while 2016 approved less than half of that number. Additionally, in 2017, the number of NME approvals at mid-year was much higher than any other year, but finished in line with the number of approvals in 2015 and well below the number of approvals in 2018. It seems that the future could go either way. There could be a dramatic up-tic in CDER approval rate as in 2018 (perhaps from shutdown-delayed applications) or the rate could slow to a crawl like in 2016. Let’s say you want to buy a new car. Now, you aren’t a car expert, but you have a general idea of features you want in your slick new whip and you can find a market-determined price for the car you want online. Every day that your new car gets you from point A to point B without violently exploding you’ll know that you made a good decision. This is what cars are like.
Drugs are not like cars. Drugs are complicated little molecules pressed into tablets that a doctor tells you to take one, two, three times per day, maybe until you die. How much do drugs cost? They cost whatever your pharmacist says they cost. Drug prices are obscured both by a lack of patient drug expertise and the complex negotiations between insurers, manufacturers, pharmacy benefit managers (PBMs) and pharmacies. Because patients cannot easily find a price for a drug it is fair to ask if they are paying too much. Fear not! The government regulates drugs, pharmacies, AND insurance companies. The government recognizes that patients do not know a lot about drugs and steps in to protect them. In fact, one of President Trump’s campaign promises was to lower the out-of-pocket costs for drugs. To that end, the Department of Health and Human Services (HHS) released American Patients First, (APF) Trump’s blueprint to lower drug prices. It’s essentially a series of hypothetical plans that could maybe lower the cost of prescriptions in the United States. The APF correctly points out that consumers asked to pay $50 vs. $10 are 4 times more likely to abandon their prescription at the pharmacy. We want patients to be able to afford their medications and to therefore be healthier. This is an important point to remember: reducing out-of-pocket costs is only useful if it increases health. Let’s see how the APF will make Americans healthier. First we need to understand the justification for this beautiful document. Why are drug prices high? Well one given reason is that the 1990s saw the release of several “blockbuster” drugs that dramatically increased pharmaceutical company revenues. However, many of these drugs lost patent protection in the mid-2000s. In order to maintain constant revenue streams, the APF posits, companies raised prices on other drugs. The Affordable Care Act (ACA) put upward pressure on drug prices in a few ways. First it increased the number of critical-need healthcare facilities that receive mandatory discounts on drugs (340B entities). It also placed taxes on branded prescription drug sales. This was implemented to shift patients and organizations away from using brand-name (read: expensive) drugs when generics are available. To pay these taxes however, drug costs had to go up. All of these justifications for high drug prices establish a pattern: if one person is paying less then the costs shift somewhere else. Someone has to pay. How does the APF plan propose to tackle high out-of-pocket costs? The strategies are presented as a four-point plan. First, it proposes that the US increase competition in pharmaceutical markets. Classic free market stuff right here. One part is a FDA regulatory change which prevents a company from blocking entry of generic competitors into the market. Seems like a straightforward good idea. The other noteworthy idea here is to change how a certain class of expensive injectable drugs, biologics, are billed. This would prevent “a race to the bottom” in biologic pricing which would make the market less attractive for generic competition. Essentially this rule could help keep biologic prices high, to make the market profitable, so there is generic competition, to lower prices. It is difficult to predict if this would work or not. The second objective is to improve government negotiation tools. This part is pretty fleshed out, with 9 different bullet points. However 8 of the 9 points relate to Medicaid or Medicare primarily helping old and/or poor people. Right now drug coverage by Medicare cannot take price into consideration when deciding whether to cover a drug. If the largest insurer in the country (the government) can start negotiating on prices, the market could shift dramatically. However someone has to pay and this may shift prices to private plans. Another goal in this section is the work with the commerce department to address the unfair disparity between drug prices in America and other countries. It is unclear how this would be achieved. The third objective is to create incentives for lower list prices. Drugs have many different prices based on who is paying on them. Companies may be incentivized to raise list prices to increase reimbursement rates since they often only receive a portion of the list price for a drug. However if the drug is not covered by a patient’s plan they could be on the hook for the inflated list price. One of the most widely criticized parts of the APF plan is to include list prices in direct-to-consumer advertising. Since most people do not pay the list price, is it even helpful to include? Probably not. The final objective is to bring down out-of-pocket costs. I thought this was the purpose of the whole document so I was surprised that it is also one of the sub-sections. Both of the proposals here target Medicare Part D, so they may have limited benefits to non-Medicare patients. One proposal is to block “gag clauses” that prevent pharmacies from telling patients when they could save money by not using insurance. While this will indeed lower out of pocket costs for certain prescriptions, the point of insurance is to spread out the costs. The inevitable side effect will be price increases in other prescriptions. The long final portion of the document is a topic by topic list of questions that need to be addressed. Who knew that healthcare was so complicated? There are some good ideas in here that need to be explored like indication-based pricing or outcomes-based contracts. Austin Frakt has a good piece on these here. My favorite question in the section is: “How and by whom should value be determined??” Yes the question in the APF includes the double question marks. This questions really gets to the philosophical crux of the healthcare problem. It should be pretty simple to solve. Here are some other quotes: “Should PBMs be obligated to act solely in the interest of the entity for whom they are managing pharmaceutical benefits?”
As of this writing, none of these policies have been implemented, but the President could instruct the FDA to begin them theoretically whenever. There are still many implications to these policies that are unknown. Each one likely has unintended consequences, as all policies do. The two critical questions we need to ask of our policy makers going forward are:
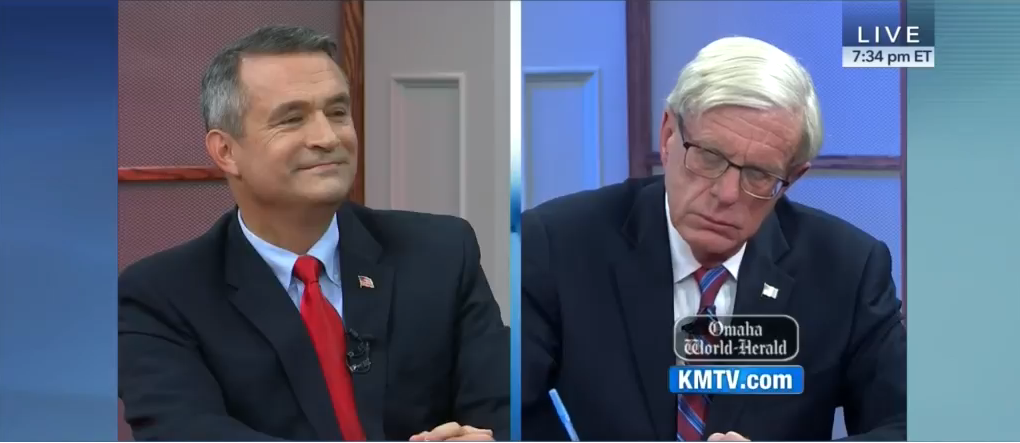
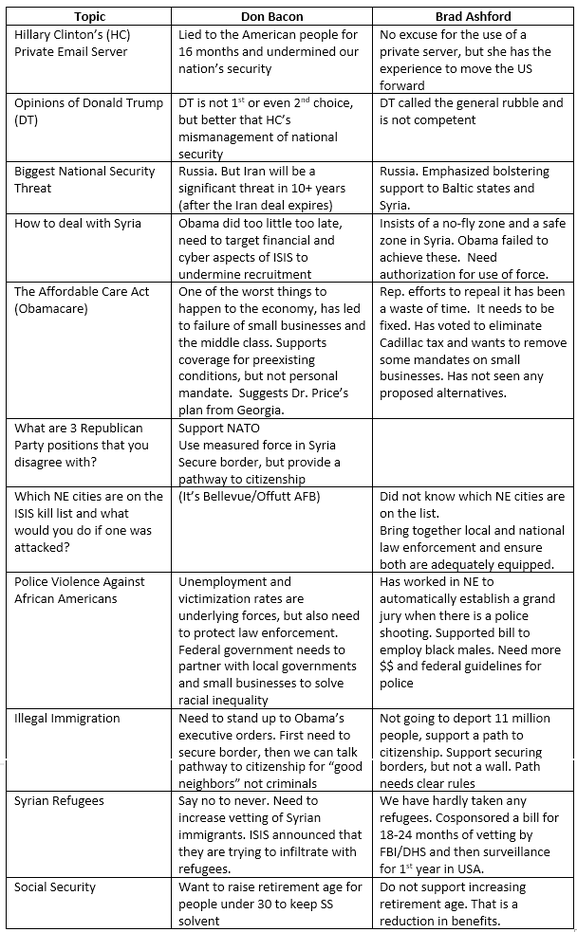
So uh good luck to us. Absentee voting has already begun in Nebraska. And it turns out there are more names on the ballot than just the presidential candidates. If you live in Nebraska’s 2nd congressional district then you also get to vote for your representative to the US House! Nate Silver’s FiveThirtyEight polls-only forecast has the district as a dead heat between presidential candidates Hillary Clinton and Donald Trump which could translate to a contested race for the House. Below I have some SparkNotes™ from the congressional debate so all of us in NE02 can get informed together. But first some formalities: Brad Ashford was elected to represent the NE02 in 2014, the first Democrat to hold the seat since 1995. Before that he served in Nebraska Unicameral (District 20) from 1987-1994 and from 2006-2015. You can read more about Brad Ashford at Ballotpedia or on his campaign website. Don Bacon is a retired US Air Force brigadier general from Papillion. He is currently an assistant professor in leadership at Bellevue University. You can read more about Don Bacon at Ballotpedia or on his campaign website. You can watch the debate and read the transcript on CSPAN here. Some questions below only have answers from one candidate; those are questions that they asked each other (how cute). The notes get longer as the debate progresses as the candidates begin having more of an open dialogue. Some final thoughts: Mike’l Severe and Craig Nigrelli did an excellent job of moderating this (amazingly) civilized debate. Don clearly had some talking points that he wanted to squeeze in that took him off topic on occasion. Brad was very polished at the beginning of the debate, but while he maintained his substance, he lost some of that polish later on. Brad also thanked Don for his service on multiple occasions while Don attacked Brad as a career politician while he himself was an outsider. Obviously this is not comprehensive and I would encourage you to look further into these candidates, but if you do not have time I hope this helped to inform your decision. Or it did not and you are still going to vote along party lines. That’s cool too just don’t forget to register to vote!
Online voter registration in NE ends at 5:00pm on October 21st. You can register here. Image source: NY Times
Food stamps are mysterious. They are kind of like cobras. I have never seen one up close nor do I want to. Are they actually stamps? Like mail stamps? No idea. But just because cobras are not a part of my daily life does not mean that they should be ignored. Food Stamps were utilized by over 45 million Americans in 2016 totaling $75 billion (less than 2% of the federal budget). That is not insignificant. So let’s check our privilege and become informed voters by (briefly) diving into the world of Food Stamps. First, the term “Food Stamps” is passé. The government renamed it the Supplemental Nutrition Assistance Program or SNAP in 2008, though states are free to call it whatever they want (a small victory for states’ rights). EBT is another term that occasionally appears in grocery store windows and that I surmised was loosely associated with food stamps. EBT, or Electronic Benefits Transfer, is essentially synonymous with SNAP. An EBT card has funds transferred to it at the beginning of every month which can then be used for SNAP purchases. So the “stamps” are not literal stamps. Nor were they ever really what I would consider stamps, but rather funny-colored tiny bills (see above). A person with an EBT card loaded with SNAP $$$ can purchase just about anything at a grocery store with a nutrition label. It is probably easier to list what you cannot purchase with food stamps than what you can:
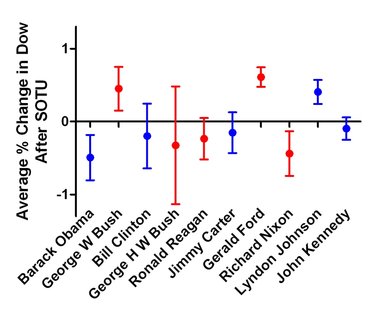
Applicants have to meet certain income tests to be eligible for SNAP. They must have a net monthly income below the federal poverty level. Additionally some states have asset requirements that limit the amount of savings or property a recipient can own. Citizens can be considered categorically eligible if they meet the requirements for other federal programs. Several deductions factor into the calculations for benefits, including excessive housing costs. If an applicant spends more than 50% of their income on rent, anything above 50% can be deducted from their income for SNAP calculations. Certain aged and disabled populations also have lower restrictions on benefits from SNAP. Applying for SNAP is not easy and the application varies between states. Iowa for example has a 19 page form that looks way more complicated than a 1040 tax form. I did not even want to read it much less attempt to fill it out. The rigor in the application process is meant to curtail fraud but it also places a burden on the family receiving the benefits and increases the administrative costs for the case workers who have to review the forms. Benefits are calculated assuming a household spends 30% of its budget on food. So the difference between 30% of the net income and the maximum allowed federal benefits based on family size is the amount received. For a family of 4 the maximum benefits are $649 which is about $6 less than the projected cost of the TFP for a family with two kids aged 6-8 and 9-11. The deficit is more pronounced for a family of two adults. This emphasizes the “supplemental” part in SNAP’s name. Even purchasing scant rations based on the TFP does not guarantee an adequate diet. Exacerbating this problem is state-to-state variability in food prices. While the federal maximum benefits are fixed in the contiguous 48 states, food prices in Connecticut can be over 30% higher than the national average or 11% lower in Texas. SNAP does have some economic upside. SNAP spending by the government has a multiplier effect. For every $1 spent on SNAP the US GDP increases by $1.79. SNAP also decreases hospitalization costs and improves school attendance for children. SNAP has its benefits and drawbacks but for over 10% of Americans it is a necessity. If you want to learn more about SNAP or to try and live the SNAP life at home check out the “Food Stamped” documentary website for details. To find more specific statistics for SNAP in your state check out the interactive map at the Center on Budget and Policy Priorities. To find out more information about cobras click here. “Uh oh, I probably should have cashed out my Robinhood account today” was my immediate thought before the page even loaded. What followed was a short blurb about presidents and then a long list of each State of the Union (SOTU) and the corresponding percentage change in the Dow the following day starting from 1961 copied from The Wall Street Journal. A list of numbers? That is just begging to be played with. Here is a graph of the average percent change for each president. The bars are Standard Error from the Mean. (Guess what the colors mean): Ouch. Looks like on average President Obama’s updates have been a net loss. President Bush’s speeches on the other hand have been a boon for our economy. And we should have had President Ford giving SOTU speeches every day. He had the greatest average effect on the stock market (or at least the Dow) with a whopping +0.61%. It is possible that was a big effect in those days but now we see that much volatility on a below-average Tuesday.
The overall average for the speeches was -0.05%. Instinctually this makes sense. The SOTU is a chance for the President to remind us of all the shitty things happening right now and what wacky plans they have for fixing them. This is understandably going to inject uncertainty into the economy. Republicans have a slight tendency to bring the Dow up, +0.003%. The Democrats, -0.112%, not so much. If you think about what Republican and Democrat presidents might highlight (Tax breaks vs. Social Spending) this is also intuitive. Basically it becomes giving wealthier people (read: people who invest in stocks) money or taking it away and giving it to those most in need (i.e. people who would rather spend their money on rent or Taco Bell than a share of Google stock). I also ran some regressions to see if the parties of the House and Senate mattered (they don’t) and to see if it mattered whether the House, Senate, and President were in the same party (also a no). What’s my prediction you ask? I bet Barack will stick to his guns and we will see another drop tomorrow, especially with all this talk about raising capital gains taxes, but probably not one that is out of the ordinary in magnitude. With a Republican House and Senate the likelihood of any changes in the capital gains tax impossible anyway. So the Dow should chill out. |
Archives
July 2023
Categories
All
|




 RSS Feed