It is always interesting when you look at this planet of ours in a new way! Did anything surprise you in the figure?
0 Comments
In a previous post I used ChatGPT to generate a plot synopsis for a Star Trek episode that has never existed. It’s response was well organized, coherent, and a huge improvement over the previous artificial intelligence/machine learning (AI/ML) methods that I used for a similar project in 2018. Other groups have used ChatGPT to take law and business school classes where it has performed as a C+/B- level student. The newest version of ChatGPT, GPT-4, even passed the bar exam, scoring in the 90th percentile of test takers. Inspired by these case studies, below I describe how I applied ChatGPT to another human-centric decision-making exam: The U.S. Foreign Service Officer Test (FSOT) Situational Judgement Test (SJT).
U.S. Foreign Service Officers (FSO) are the diplomats who represent the United States abroad at embassies and consulates. Their mission is to “promote peace, support prosperity, and protect American citizens while advancing the interests of the U.S. abroad.” Becoming an FSO is a multistep process, but one of the initial steps is taking the FSOT which consists of one essay and three multiple choice sections: job knowledge, English expression, and situational judgement. The SJT is the focus of today’s experiment. From the Information Guide to FSO Selection: “The [SJT] is designed to assess an individual's ability to determine the most and least appropriate actions given a series of scenarios. The questions were written to assess precepts or competencies that are related to the job of a Foreign Service Officer, including Adaptability, Decision Making and Judgment, Operational Effectiveness, Professional Standards, Team Building, and Workplace Perceptiveness. (NOTE: Knowledge about the State Department's policies, procedures, or organizational culture is NOT required to answer these questions.)” Each question of the SJT presents descriptions of situations that an FSO might encounter on the job along with possible responses to that situation. For each scenario, test takers are to select the best and worst responses. Extensive blog posts have been written on how to approach these questions because, unlike job knowledge or English language, this section is perceived as less objective and, as the description and name imply, more based on judgement. This is what makes assessing an AI’s performance on this section the most interesting. Would AI have better judgement than an FSO? To approach this, I used a sample of 20 SJT questions from the internet with available answers. Here is one example SJT question: There are multiple tasks to be completed by the end of the day. Three people will be arriving to complete these tasks. What should you do? A. Make a detailed list of everything to do, and leave it for the three people to divide up among themselves. B. Make a detailed list for each person to do, ensuring each list is tailored to each person's strengths. C. Talk to each person and assign tasks based on their interests. D. Ask the first person who arrives to be in charge of coordinating the work with the other two. (answers below) I sent this question and the other 19 to ChatGPT (version 3.5 Turbo) in a few variations. In the first and simplest variation, I only gave the AI instructions to determine the best and worst responses. In the second variation, I gave the AI the context from the Information Guide to FSO Selection shown above in addition to the instructions. In the third and final variation, I gave the same information as the second variation but used a slightly different model, version 3.5 Turbo-16K (at the time of writing GPT-4 was not available to the author via the API). Overall, the third variation with the full context and the larger model scored the most points (70%; 28 out of a possible 40) followed by the second variation (65%; 26/40) and the first variation (57.5%; 23/40). There was a lot of variation between the models and the third variation answered some questions incorrectly that the other variations answered correctly. In one extreme example, variations two and three got both parts of the question incorrect while variation one got one part correct. Embarrassingly, for this question the second variation thought that the best answer was the worst answer. On another occasion, variations one and two got both parts correct but variation three guessed incorrect on the worst response. Finally, on the example question given above, only the third variation got the correct answer with the other two variations getting opposite parts of the question correct. These variations are due to the non-deterministic nature of ChatGPT. Because of this randomness, it would be wise to run each variation multiple times to get average scores for each. Why didn’t I do this? While there is some financial cost associated with running these models, that was not the rate limiting step that prevented these additional tests (this whole post only cost $0.08). The real cost was time. Despite several efforts, ChatGPT was always too verbose in its response. It gave too much context to its answers making it time consuming to figure out the results of each run for the 20 questions. More trial and error with prompt optimization would eventually produce more streamlined answers (deeplearning.ai has a good online course on this topic that informed much of this work). So, would ChatGPT be an FSO with sound judgement? We don’t know! The test scores are normalized to the average of other test takers, and we do not know what a typical passing score on this part of the test is. With a score of 70%, it is possible that the third variation could be in contention. The fact that all three variations were able to score so highly at all on multipart, multiple-choice questions on complex social scenarios is a testament to how far this technology has advanced. The SJT portion of the FSOT is the most interesting test or ChatGPT because judgement is the skill that is the most "human" of the three test components. There are already AI tools to check spelling, commas, and other English grammar points. ChatGPT was trained on a broadcast of knowledge and would likely be able to pass the fact-based job knowledge portion of the exam. Taken together with this test, I am confident that ChatGPT could pass the FSOT. However, the FSOT is only one part of the FSO application. What would an AI write for its personal narratives and previous job experience? How would it participate in the in-person oral exam? Furthermore, this experiment did not evaluate if ChatGPT would be effective at determining who gets a visa, representing government interests in a negotiation, or visiting a citizen in prison. It cannot fully replace a human. But just because it cannot do all aspects of the job, does not mean that it would not be useful. This experiment demonstrates that ChatGPT and similar LLMs may be able to be more supportive in diplomatic work than one might naively assume. The zeitgeist is grappling with whose jobs are going to be taken by AI in the near and far future. Are Diplomats unreplaceable in the long run? Future iterations of ChatGPT-like AI may be able to handle all diplomatic work without human intervention, but not now. However, this work shows that AI today is capable of applying judgements to social situations, potentially making it more useful than one might first assume. The real short-term risk is not that diplomats are replaced by AI, but rather that diplomats do not embrace AI as a force multiplier and get left behind in this new chapter of our AI-enabled world. In 2018, I trained a recurrent neural network—a type of artificial intelligence/machine learning (AI/ML)—on all the plots of Star Trek (TNG, DS9, and VOY). The proposed goal was to have the network create new and exciting plots based off the characters, places, and themes of the original episodes. After training for 24 hours, I asked the neural network to generate new text based on what it had “learned.” As you can read in my previous post, the output was more or less Star-Trek-Themed nonsense. While the network output words in an order that approximated sentences, there was no sense of plot or structure in the output. However, at the time this was indicative of the cutting edge AI/ML technologies available. And in a world without new Star Trek it was an entertaining nostalgic diversion.
Since that prior post two things have happened. First, in 2023 the media-consuming public are in the midst of something like a Star Trek renaissance with several series—Discovery, Picard, Prodigy, Below Decks, and Strange New Words—all bringing new ideas to the Star Trek canon. Second, more recently and more crucially, ChatGPT has been released by OpenAI. This new tool makes generating text using AI significantly easier and more intuitive. My original recurrent neural network experiment was extremely cumbersome. It required 24 hours of training on my personal laptop. It required Python code to extract the plot synopses, train the model, and request the output. After all that the model produced output letter-by-letter that was not usable for the desired purpose. By contrast, the ChatGPT tool is both more useful and more usable. ChatGPT is a generalized Large Language Model that the OpenAI team has pretrained on enormous servers, giving it far more training than my laptop ever could. It can generate responses to complex prompts that incorporate prior context and knowledge from the internet. On top of that, it can be accessed by anyone for free via an easy to use chat-like interface instead of complex Python code. To demonstrate how much better the ChatGPT output is, here is one sample synopsis that ChatGPT produced for me when given the prompt, “Write a 100 word plot synopsis for an episode of the television show Star Trek Deep Space 9 that has never existed.” “Title: Shadows of the Past In the unexplored Gamma Quadrant, the crew of Deep Space 9 investigates a planet trapped in a repeating temporal loop. They discover the Zynthians, a technologically advanced species, who made a pact with a malevolent entity, leading to their downfall. The crew must break the cycle and free the Zynthians, facing temporal distortions and moral dilemmas. Unity and forgiveness become the key to redemption as they race against time. This thought-provoking episode explores the consequences of choices and the power of hope, reminding us that even in darkness, understanding can pave the way for a brighter future.” This response demonstrates some key improvements over the text that my recurrent neural network generated. The plot follows conventional story structure and includes the same alien species throughout (the Zythians). It generated a relevant title based on the plot. ChatGPT knew that Star Trek: DS9 takes place in the fictional Gamma Quadrant and a longer version of this synopsis included the names of the main characters of the show. Recognizing that Star Trek episodes usually have a moral or philosophical theme it emphasized that this episode focuses on “the consequences of choices and the power of hope.” Overall, this is a monumental improvement over my previous attempts and demonstrates that utility and usability of ChatGPT in generating text. In 2018, leading experts in the field were effusive in their praise for recurrent neural networks and how great they were. Now, five years later, the AI community has taken a dramatic leap forward. Despite these improvements, the output is far from perfect. Longer versions of the response had conflicting themes and ChatGPT's output are necessarily derivative of existing Star Trek works. At the time of writing, there is an ongoing writer's strike. It is important to recognize that while AI has improved dramatically, it cannot replace real writers. It remains a tool, that is useful but not creative or emotive. However, given the strides in development, it is not unreasonable to think that the next update to this blog post in 2028 will feature AI-generated plots, scripts, audio, and video all at the push of a button. Whether those are any good, remains to be seen. But, at that point it may feel more like we are living in the Star Trek universe rather than writing fiction about it. During the height of the COVID-19 pandemic, everyone was trapped indoors. Various jurisdictions had different policies on appropriate justifications for venturing outside. I vividly remember the DC National Guard being deployed to manage the flow of people into the nearby fish market. However, throughout the pandemic, outdoor and socially distant running or exercising was generally allowed. Because the gyms were closed and the outdoors were open, my miles run per week shot up dramatically. I even wrote a blog post about it in April 2020. Now the pandemic has subsided, but I the running has not. In fact, I’m running more than ever in a hunt for a Boston Marathon qualifying time. During this expanded training, and throughout the past three years, I have run many of the local DC streets. I have updated the running heatmap that I published in 2020 after several thousand additional miles in the District. I’ve been told the premium version of the Strava run tracking phone app will make a similar map for you. This data did come from Strava, but I’ve created my own map on the cheap using a pinch of guile (read: R and Excel). 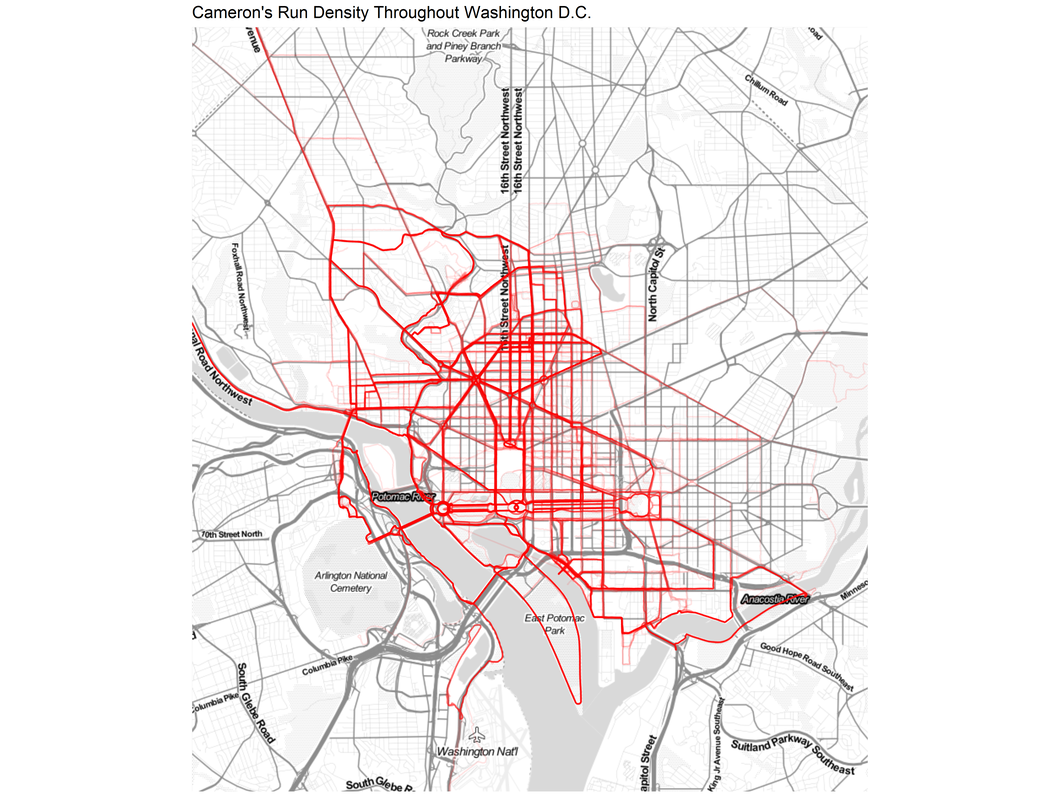 This version of the map features a larger geographic area to capture some of the more adventurous runs that I have taken to places like the National Arboretum, the C&O Trail, and down past DCA airport. The highest densities of runs are along the main streets around downtown, Dupont Circle, and the National Mall. Rosslyn and south of the airport were two areas that I wanted to explore more in my 2020 post, both of which show up in darker red on this new figure. To complement the geographic distribution of runs is a visual distribution of average pace vs. run distance. This was a challenge to analyze because the data and dates were downloaded in Spanish (don’t ask), but eventually I was able to plot each of the 798 (!) DC-based runs over the past five years. The runs in 2023 are highlighted in red. 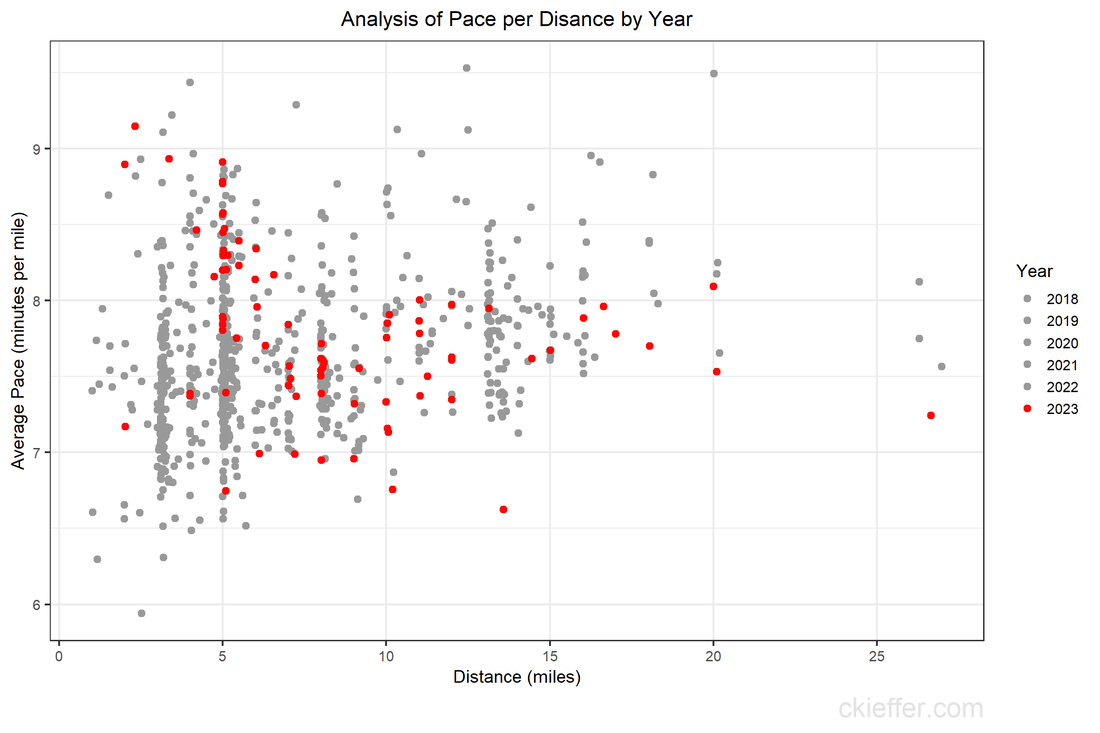 Luckily, the analysis reveals that many of the fastest runs for each distance are in the past 6 months. Progress! My rededication to running at a more relaxed pace for my five mile recovery runs is also visible. The next step is to fill in the space this figure with red dots for the rest of 2023 with the ultimate goal of placing a new dot in the bottom right corner by 2024. Wish me luck.
Back in January of 2020, when I was a brand-new AAAS Science and Technology Policy Fellow (STPF), I wrote a blog post centered around a plot of the history of the STPF. That figure contained data from all the way back in 1973 through 2019. Today’s post is an updated revisit to that post using the most recent trends in the fellowship. If you’re curious about the history of the AAAS STPF, I recommend checking out this timeline on their website and revisiting the previous version of this figure. Here’s the updated figure: 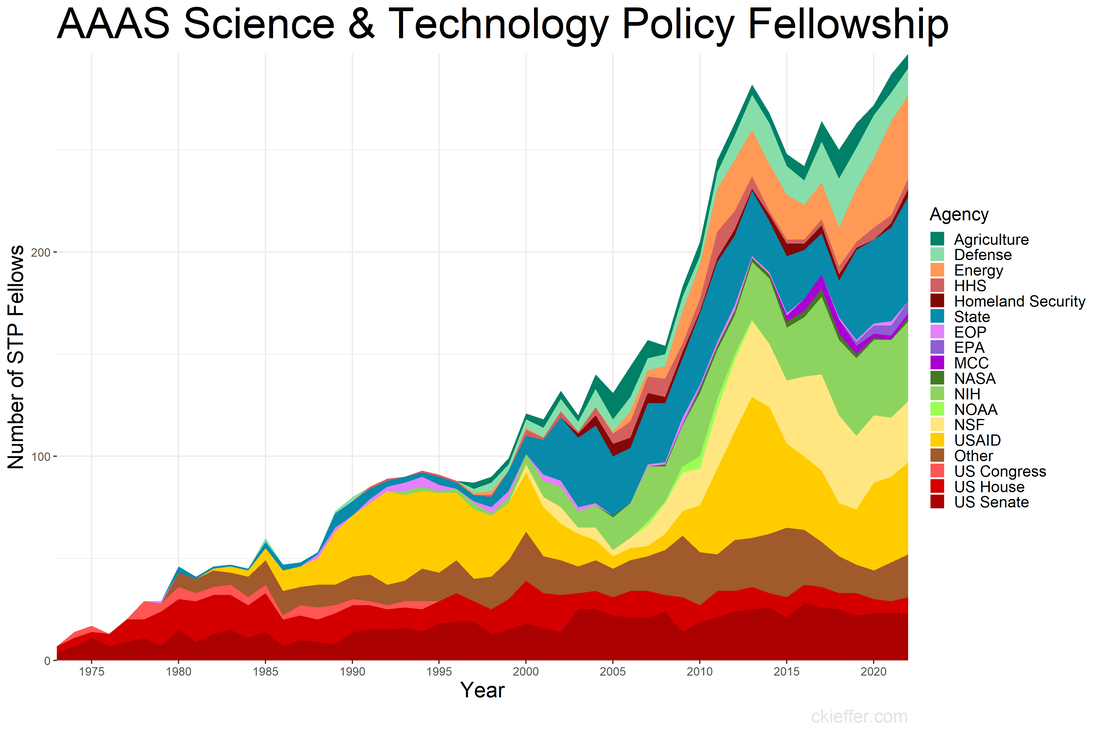 One major event has happened since the last update: the COVID-19 pandemic. This has not appeared to have had a dramatic affect on the trends in 2020 or after. In fact, the fellowship has recovered well following the pandemic with a record high number of fellows in 2022 (297). This was driven in part by increases in the number of fellows at State, USAID, and in “Other” agencies in the past three years. Since the previous analysis, three new agencies have received fellows for the first time: the Department of the Treasury, the Architect of the Capitol, and AAAS itself.
The AAAS STPF appears to be on an upward and healthy trajectory, unhindered by the global pandemic or any of our other global crises. One former fellow asked to comment on the updated figure said, "it shows the continued importance of science that drives solutions to global crises." Well said. Coda: This is a quick post to update the trends. If nothing else, it keeps my R skills up to date and gives the new fellows the lay of the land. Since that original post, I've written two other AAAS STPF-themed posts on placement office retention and my own knowledge gained through the fellowship. Check those out to learn more about the fellowship. Almost every Thursday at noon, it is time to open WebEx for a video conference. This is not for a business meeting; it is for the weekly gathering of my local Toastmasters club. For the past three years or so, I have been attending these Toastmasters meetings and have found them a great way to develop speaking, time management, and leadership skills in a supportive and friendly environment.
If you aren’t familiar with Toastmasters International they are “a nonprofit educational organization that teaches public speaking and leadership skills through a worldwide network of clubs. Headquartered in Englewood, Colorado, the organization's membership is approximately 280,000 in more than 14,700 clubs in 144 countries. Since 1924, Toastmasters International has helped people from diverse backgrounds become more confident speakers, communicators, and leaders.” What does the program look like practically? Each participant selects a pathway based on their own speaking and leadership goals. Based on their chosen pathway, they review a series of educational materials online and then prepare a speech to practice the fundamental skills they have learned. In addition to the pathways, participants practice their speaking and leadership skills each week by participating in the weekly meetings. I have found my time spent in Toastmasters to be rewarding, both because of the professional skills I have developed, but also because of the new friends that I have made. I would recommend giving the program a try. This month, as part of my pathway, I am practicing my ability to “write a compelling blog.” While I have had a blog off and on since 2015, this is a great opportunity to refresh the site, reflect on its purpose, and complete some long-overdue projects and updates. It is also an opportunity to get back to one of the reasons I started this in the first place: to practice writing about things I think are interesting. So, this month will see eight new blog plots, including this one. Stay tuned for more updates and posts. “Can you teach an old scientist new tricks?” is a question that you have likely never asked yourself. But if you think about it, presumably, scientists should be adept at absorbing new information and then adjusting their world view accordingly. However, does that hold for non-science topics such as federal policy making? More and more the United States needs scientists who have non-science skills in order to make tangible advancements on topics such as climate change, space exploration, biological weapons, and the opioid crisis. The American Association for the Advancement of Science (AAAS) Science and Technology Policy Fellowship (STPF) helps to meet that need for scientists in government as well as to teach scientists the skills they need to succeed in policymaking. As the United States’ preeminent science policy fellowship, the AAAS STPF places doctoral-level scientists in the federal government to increase evidence-informed practices across government. In 2019, the program placed 268 scientists in 21 different federal agencies. Beyond simply lending some brilliant brains to the government, the AAAS STPF is a professional development program meant to benefit the scientist as much as the hosting agency. In addition to hands-on experience in government, fellows create individual development plans, attend professional development programming, start affinity groups, and spend program development funds. As part of its monitoring and evaluation of the learning in their program, AAAS sends out a biannual survey—that is, two times per year—to fellows to monitor changes in knowledge and ability, among other things. Now, as a spoiler, I was a AAAS STPF from 2019-2021 and I am sharing some of my survey results below, presented in the most compelling data visual medium—screenshots of spreadsheets. Each of the four columns represents on of the biannual surveys. Let's see how much I learned: 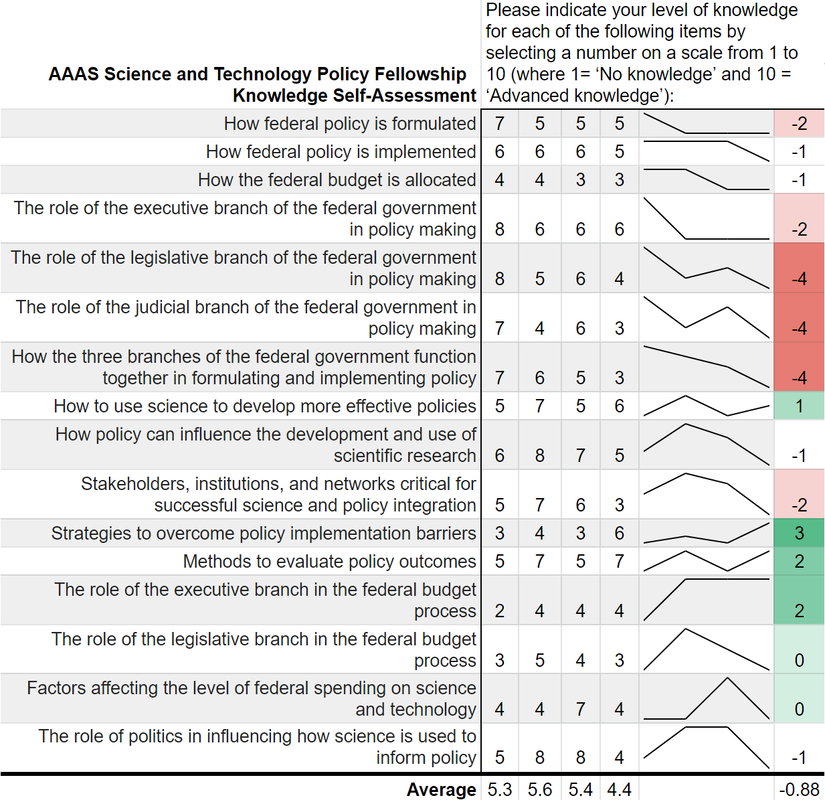 Um, where is the learning? Starting with my knowledge self-assessment, the outcomes are, at first blush, resoundingly negative. The average scores were lowest in the final evaluation of my fellowship (4.4 points) with an average fellowship-long change of -0.88 points. I was particularly bullish on my confidence in understanding each branch’s contribution policy making at the beginning of the fellowship and incredibly unsure of how policy was made at the close of the fellowship. There is however, one positive cluster of green boxes. These seem to focus more on learning about the budget, which I initially knew nothing about. Also, the positive items—with terms like “strategies” and “methods”--are more tangible and action focused. This would seem to support the value of the hands on experience compared to some of the more abstract concepts of how the government at large works. While not a glowing assessment of the program, let’s move on to the ability self-assessment… 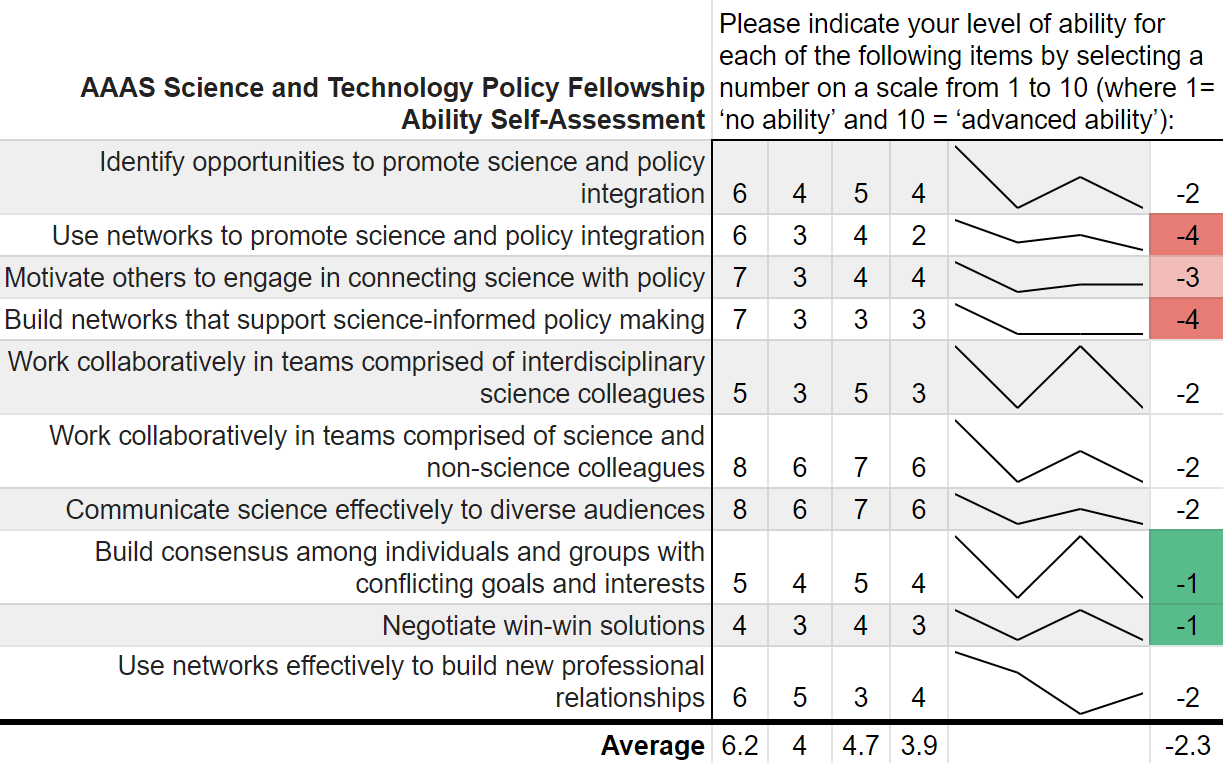 Yikes; that's even worse! There isn’t a single positive score differential on my ability self-assessment across the two years. Did I truly learn nothing? While the knowledge self-assessment had a small average point decline across the two years of the fellowship (0.9 points), the ability self-assessment had a larger average decline of 2.3 points. This decline was largest in my perceived ability to use and build networks. The working hypothesis to explain this discrepancy is, what else, the COVID-19 global pandemic. This dramatically reduced the ability to meet in groups and collaborate, something that many of these ability questions focus on. My responses here also had more noise and fewer clear trends compared to the knowledge self-assessment.
While COVID-19 likely played some role, both parts of the survey suffer from a pronounced Dunning-Kruger effect. Before the program I read the news, had taken AP Government, and had seen SchoolHouse Rock. Apparently, I thought that was sufficient to make me well-informed. This was a bold opinion considering that I was not 100% sure what the State Department did. After some practical experience in government, I slowly understood the complexities of the interconnected systems. Rather, I should say that I did not understand the labyrinthine bureaucracies, but at least began to appreciate their magnitude. That appreciation is what contributed to the decrease in survey scores over time. Not a lack of learning, but instead the learning of hidden truths juxtaposed with my initial ignorance. Despite these survey data, the AAAS STPF has taught me a tremendous amount about the federal government, policy making, and science’s role in that process. The first question on the survey is “Overall, how satisfied are you with your experience as a AAAS Science & Technology Policy fellow?” which I consistently rated as “Very Satisfied.” Increasingly, more and more fellows are remaining in the same office for a second year, indicating a high level of program satisfaction. The number reupping now sits around 70%. Finally, this is only a single data point from me. I did not ask AAAS for their data, but I have a sneaking suspicion that would be reluctant to part with it. Therefore, it is possible that no other fellows have this problem. Every other fellow is completely clear eyed and knows the truth about both themselves and the U.S. government. But if that was the case, then we wouldn’t need the AAAS STPF at all. I am glad that I learned what I didn’t know. Now I am off to learn my next trick. Today’s digital age is the best time to learn Mandarin Chinese because of the numerous online tools available. The Chinese language learning blog Hacking Chinese has catalogued over a thousand relevant resources. On Hacking Chinese’s 50th podcast episode Julien Leyre discusses his doctoral thesis on modern Chinese language learning tools, his efforts to categorize them, and how they can work together. One identified problem with all these resources is that new Mandarin Chinese language learners do not know where to start.
I am not a fluent Mandarin speaker, a linguist, or a language learning expert, but I have spent a few years trying out different Mandarin learning tools through my own self directed study. Some have become part of my daily language learning, while I’ve tossed others in the bin. In an effort to share the results of my own struggles and experiments, below is a short list of resources along with any identified pros and cons. If you want a comprehensive list of resources, I suggest checking out Hacking Chinese, but if you want a place to start, look below. [For truly new learners of Mandarin, I want to define two terms before the lists. First, Pinyin is the romanization of Chinese characters. It takes the sounds of thousands of Chinese characters and presents those sounds in approximations in the Latin alphabet. Second, the Hanyu Shuiping Kaoshi (HSK) is an official People’s Republic of China (PRC) Chinese language proficiency test for non-native speakers. The test has various levels, which can be used to determine one’s proficiency in the language. Now, onto the resources.] General
Structured Coursework
Reading
Flashcards
Listening
This (surprisingly long) list is only a small fraction of the options Mandarin learners now have at their fingertips. This list is not a roadmap to Mandarin language proficiency, but hopefully it gave you the materials to build the road. Your first step is to try a few and make choices on how you can efficiently spend your time while ensuring the content is entertaining enough to keep you engaged. Learning Chinese is a worthwhile, challenging endeavor, but with technology, is now easier than ever. 加油!  This post was originally posted on the State Department DipNote blog on June 26, 2021 for the International Day against Drug Abuse and Illicit Trafficking.
Many people are afraid to go to the doctor or the dentist for medical treatment. What if they find something? Will people find out that I have a disease? What will people think of me if they do? This feeling is common, and it arises from the idea that a diagnosis acts as a stigma — a “mark” of shame or disgrace – and may lead to social exclusion. The fear of being stigmatized, or labeled with a negative trait, can be particularly strong for people who use drugs or with a substance use disorder. The UN Office on Drugs and Crime estimates that more than 36 million people worldwide have a substance use disorder while seven in eight people who suffer from drug use disorders remain without appropriate care. The State Department’s Bureau of International Narcotics and Law Enforcement Affairs (INL) is committed to reducing stigma, supporting people with substance use disorders around the world, and increasing access to evidence-based prevention, harm-reduction, treatment, and recovery tools. For people with a substance use disorder, stigma often leads to acts of discrimination. It can result in being treated differently by doctors and can cause individuals to avoid seeking help because they believe that they are not deserving of care. Discriminatory policies, such as directing resources away from drug treatment, can decrease the availability of treatment services or result in people with a substance use disorder being denied access to healthcare, social services, housing, or employment. Taken together, the effects of stigma create numerous barriers to accessing needed drug treatment services around the world. INL works to improve the access to and quality of substance use prevention and treatment services around the world. By doing so, we shrink the global market for drugs, which denies income to international criminal groups and reduces the amount of drugs coming to the United States. In the 12-month period ending November 2020, an estimated 90,000 people died from drug overdoses in the United States. INL has worked with the Community Anti-Drug Coalitions of America since 2012 to support the establishment of over 300 community coalitions in 28 countries, bringing together a variety of stakeholders including schools, businesses, healthcare providers, law enforcement, government agencies, and the media to address local factors that contribute to drug use. By engaging the entire community, these coalitions can demystify substance use disorder, reducing the impacts of stigma. Additionally, to ensure that patients seeking care for substance use are met with well-informed, professional practices backed by cutting-edge research, INL developed Universal Curricula to help treatment professionals around the world provide appropriate, quality care. This global prevention and treatment workforce is integrated through the INL-supported International Society of Substance Use Professionals (ISSUP), which brings together over 18,000 members to strengthen research, practice, and policymaking, including by reducing stigma. INL also facilitates youth forums where participants develop projects to prevent substance use in their communities, including by increasing awareness through sharing facts, by building the self-esteem of students, and by creating drug-free after school spaces. The theme for this year’s International Day Against Drug Abuse and Illicit Trafficking is “Share Facts on Drugs. Save Lives.” On an individual level, everyone can help to reduce the stigma around substance use disorders by using non-stigmatizing language and by educating themselves to recognize and reject common myths on drug use. MYTH: Drug users are bad people or criminals. FACT: Substance use disorder is a chronic relapsing medical condition deserving of care. People may commit crimes to support an active substance use disorder but treating the underlying substance use disorder is often more effective than incarceration at reducing the prevalence of these crimes. MYTH: Substance use disorder treatment does not work because everyone relapses. FACT: When treatment is stopped, patients with chronic conditions such as asthma, diabetes, and hypertension may experience worsening symptoms that can require medical intervention to re-stabilize. Substance use disorder is similar. Recovery from a substance use disorder is a life-long process, and ongoing medical maintenance and monitoring increases the effectiveness of treatment and reduces the risk of relapse. MYTH: Medications for substance use disorder just substitute one addictive drug for another. FACT: When people who are dependent on drugs stop taking drugs, they often suffer severe withdrawal symptoms which can be life-threatening and may contribute to the risk of relapse in the short- and long-term. Medications for substance use disorder reduce these symptoms without producing positive effects like euphoria. Additionally, these medications make it less intimidating to start treatment and are proven to increase the chances of maintaining long-term recovery. MYTH: Shaming drug users helps prevent young people from experimenting with drugs. FACT: Scare tactics and social stigma against people who use drugs are not effective prevention tools. These methods can backfire by causing young people to see addiction as something that happens to “other people” instead of “people just like them,” and may prevent them from recognizing the early signs of problematic use in themselves or their friends. Stigma is a persistent challenge and combating it is critical to addressing substance use and saving lives in the United States and around the globe. INL is committed to this work and to ensuring everyone has access to quality, evidence-based prevention, treatment, and recovery services.  Where can love be found? Presumably, anywhere: school, the internet, a coffee shop, even, as Rihanna pointed out in her 2011 hit song, in a hopeless place. In 2002, that list grew and love could also be found on television.
Having never seen a single episode of The Bachelor, I thought I would be the perfect person to write about it authoritatively after several hours of research. This impulse was derived, in part, from a friend’s recommendation that I apply to be on the show. Regardless, I will briefly be presenting The Bachelor in three ways: Bachelor as text, Bachelor as subtext, and Bachelor as commodity. Or, in other words, what the show does, what the show says, and what the show is. Part I: The Bachelor as text On its face, the bachelor is a straightforward show. Twenty-five women compete for the affections of one eligible bachelor. Contestants and the bachelor go on dates to gauge their compatibility and each episode ends with a rose ceremony. At the ceremony the titular bachelor gives roses to the subset of women that he would like to keep around and get to know, ultimately leading to a final ~magical~ proposal. In it’s imagery, unsurprisingly, the show leans heavily on romantic elements, elevating and magnifying the fantasy of the show to mythic proportions. There is a mansion, the women wear ravishing evening gowns, there are dates in exotic locations, the show provides the perfect diamond ring. There’s even a “fantasy suite.” While proposal and possibly marriage are the end of the fairy tale, this pedestrian description of the show’s structure does not capture the essence of the themes that the show conveys. Part II: The Bachelor as subtext As you may have already surmised, the “reality” in this reality tv show is anything but. The critiques of the show are many and varied: it fetishizes beauty, it objectifies women, it exclusively celebrates heterosexual romance. As Caryn Voskuil enunciated in the 2006 anthology Television, Aesthetics, and Reality, “television may have the capacity to bring about social change, [but] more often than not, it is a mirror of societies’ values and beliefs - a “myth promoter” that entertains while maintaining the status quo.” The Bachelor has no problem living in the status quo and promoting the existing myths about true love and fantastical romance. Its whole premise is based on these concepts. It takes existing social constructs of dating, both good and bad, heightens them in a ritualistic fantasy environment, and ends with an idealized amplification of those constructs pitched to the audience as reality. This show is not advancing the social discourse. However, that unrealistic fantasy itself may be the escape its audience is looking for. The courtship depicted in the show is a far cry from the real dating world where, according to Pew Research in 2020, more than half of Americans say dating app relationships are equally successful to those that begin in person. But, with some 35% of app users saying online dating makes them more pessimistic, maybe a glimpse into a mythic fantasy, pitched as reality, where traditional values are never challenged is an appealing product. While the underlying messages of the show may not be the most progressive, perhaps these concerns are overblown and the negative societal consequences only manifest if one truly believes in the show’s premise. Is anyone fooled? Does anyone think it accurately reflects reality? Part III: The Bachelor as commodity After 263 episodes, the bachelor and its many spin offs have become a mass produced media product rather than a cultural text. Over those 25 seasons, there were 15 marriage proposals with only two couples currently together, as of this writing. These results savagely undercut the mythic romance narrative sold to the audience in the text of the show, making it unlikely that it is taken on face value. While the problematic subtext remains, the show is now being rigorously dissected and enjoyed through a collection of meta-narratives, narratives grafted on top of the repetitive framework of the show, rather than the surface-level text of the show One such meta-narrative analyzes the show’s production logistics. How many instagram followers do the contestants have? How do producers make people cry or find the perfect shot to make it look like a fight occurred? Another looks at The Bachelor as sport. The Bachelor has many of the same attributes as traditional sports: weekly appointment viewing, suspense, narratives, ritual, and excitement. There are fantasy bachelor brackets and leagues. These meta-narratives are possible because of the decades-long commoditization and standardization processes over dozens of seasons. They heighten the enjoyment of watching the show, while abstracting above any problematic aspects or subtexts. Which of these is the true bachelor? Should we believe what the show does, what it says, or what it is? Of course the answer is that it is all three at once. The Bachelor is a complex show, despite the repetitive traditions it has embraced over the years. It is a sports media product about finding love in an unrealistic reality. Which, when I put it like that makes it sound a bit appealing. Maybe I will have to give it a watch. This post was adapted from a seven-minute speech presented at a Toastmasters club. |
Archives
July 2023
Categories
All
|
 RSS Feed